Atomic Structure Science Diagram – Visualizing the Essence of Science
RJ0700008_25
- Last Update 09/23/2025
- File Size 1.3MB
- # of Slides 2
- File Format PPTX
- Slide Ratio 16:9
- Color
Keywords
- #Content-Based Slides
- #Design-Based Slides
- #Company Introduction
- #Business Introduction
- #Diagram
- #Business Areas
- #Business Areas
- #Cluster
- #Spread
- #Chain Diagram
- #Centralized Diagram
- #16:9
- #radial diagram PowerPoint
- #5-node diagram slide
- #atomic structure presentation
- #science diagram template
- #center-based diagram PPT
About the Product
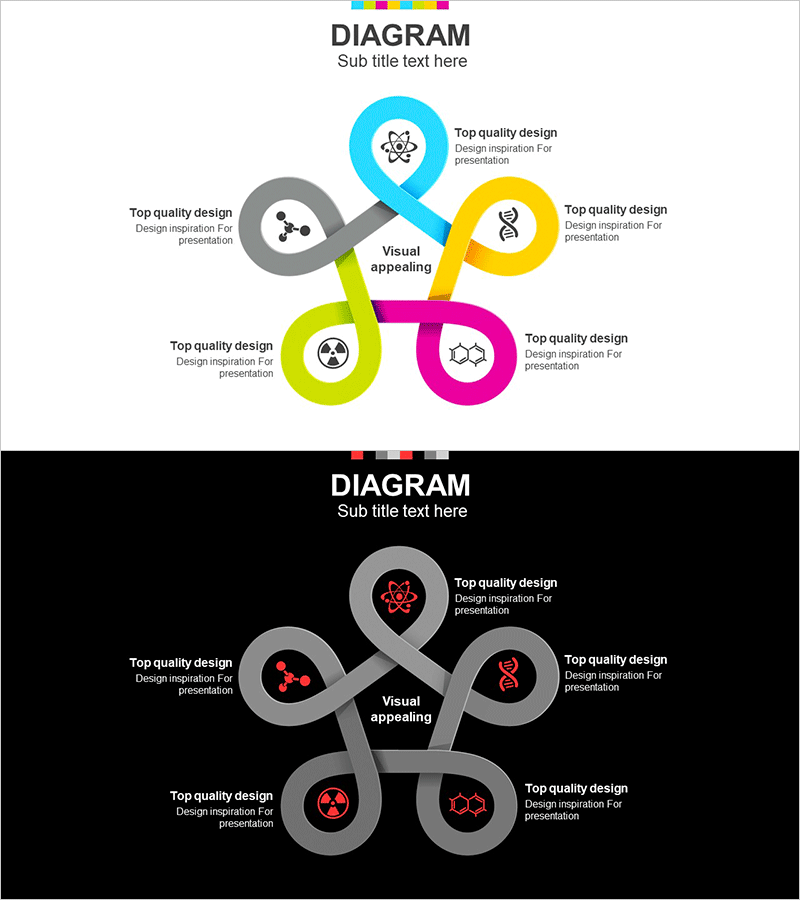
A radial diagram PowerPoint slide with five nodes radiating from a central concept, ideal for visualizing atomic structure, scientific principles, and core concept expansion. Includes two design versions: a bright background version with cyan, yellow, lime, magenta, and gray circular nodes, and a dark background version with red icons. Each node features an icon and text area for flexible content customization across science, business strategy, organizational structure, and more. Delivered in 16:9 PPTX format, fully editable and ready to use.
Usage Points
-
Main Usage
Illustrates how five key elements radiate from a central concept. Perfect for explaining atomic structure in science, business strategies derived from core values, organizational relationships between central functions and departments, and complex systems with a clear hierarchy.
-
How to Use
Replace the central 'Visual appealing' text with your main topic, then edit the five node labels and icons to match your content. Use the bright version for educational and scientific presentations, and the dark version for technology and innovation topics to maximize visual impact.
-
Recommended For
Science and physics education presentations, technology innovation explanations, organizational structure introductions, business strategy development presentations, product development process descriptions, and research result presentations. Ideal for university lectures, corporate training, academic seminars, and technology conferences.
-
Slide Structure
Two-slide set: Slide 1 features a bright background with five circular nodes in cyan, yellow, lime, magenta, and gray, plus a central node. Slide 2 uses a dark background with red icons in the same radial structure. All nodes contain independently editable text boxes and icon areas.
Related Products
-

Business Value Diagram – Visualizing Business Sectors
#Company Introduction #Business Introduction #Diagram
-

Business Area Hexagon Diagram – Optimized for Business Introduction
#Company Introduction #Business Introduction #Diagram
-

Business Areas that Visualize the Company's Strengths
#Company Introduction #Business Introduction #Diagram
-

Mobile App Service Activity Area – Harmonizing Business and Design
#Company Introduction #Business Introduction #Diagram
