Country-by-country Yield Analysis Map for Global Business Strategy
RJ0700008_24
- Last Update 08/29/2025
- File Size 1.6MB
- # of Slides 2
- File Format PPTX
- Slide Ratio 16:9
- Color
Keywords
- #Content-Based Slides
- #Design-Based Slides
- #Company Introduction
- #Marketing Plan and Strategy
- #Graph
- #Other
- #Global Network
- #Target Market Strategy
- #Horizontal Bar
- #Horizontal Bar Chart
- #Map
- #16:9
- #world map PowerPoint slide
- #map presentation template
- #global network slide
- #country data visualization
- #regional revenue analysis PPT
- #world map slide design
About the Product
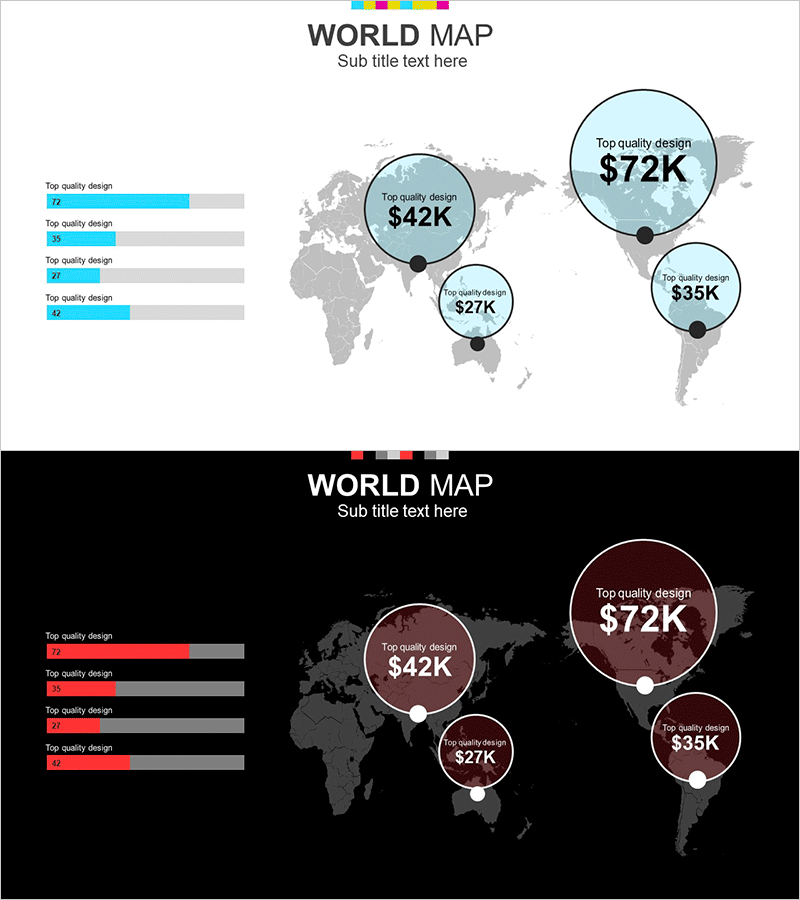
A world map-based PowerPoint slide designed for global business strategy presentations. This slide deck features two color themes—light blue and dark red—displaying revenue data for three key regions using circular charts overlaid on a world map. Each region's sales figures ($72K, $42K, $27K, $35K) are visually compared, with a horizontal bar chart on the left showing additional metrics. The 2-slide set includes both light and dark background versions, allowing you to match your presentation environment and corporate branding. Ideal for country-by-country performance analysis, global marketing strategy presentations, and international business reports.
Usage Points
-
Main Usage
Visualize global market expansion strategies, country-by-country sales performance, and international business results using map-based graphics. Circular charts on the world map display each region's revenue scale, enabling intuitive communication of international business data to stakeholders.
-
How to Use
Replace the region names and revenue figures with your actual data. Select the light blue theme for bright conference rooms and online presentations, or the dark red theme for dimly lit venues and projection settings. Modify the left-side bar chart items simultaneously to enable multi-layer data representation.
-
Recommended For
Executive briefings at multinational corporations, overseas branch performance presentations, international marketing strategy meetings, investor pitch decks, and cross-functional team collaborations. Particularly useful for executives, marketing managers, and business development professionals requiring regional and country-level comparative analysis.
-
Slide Structure
2-slide set. Each slide features a world map (gray tone) as background with 3 circular chart nodes positioned on key regions and 5-item horizontal bar chart aligned on the left. Light blue version uses bright background with cyan accents; dark red version employs black background with wine accents, enhancing data readability through color contrast.
Related Products
-

Global Network Analysis Chart – Visualizing Target Market Strategy
#Company Introduction #Marketing Plan and Strategy #Graph
-

Global Network Visualization Slide – Effective Presentation Support
#Company Introduction #Marketing Plan and Strategy #Other
-

Global Target Country Analysis Slide
#Company Introduction #Marketing Plan and Strategy #Diagram
-

Visualizing Worldwide Maritime Transportation Status – Global Market Strategy
#Company Introduction #Marketing Plan and Strategy #Diagram
