Chemical Element Diagram – Visual Representation of Composition
RJ0700008_20
- Last Update 07/23/2025
- File Size 1.2MB
- # of Slides 2
- File Format PPTX
- Slide Ratio 16:9
- Color
Keywords
- #Content-Based Slides
- #Design-Based Slides
- #Product/Service Introduction
- #Business Introduction
- #Diagram
- #Composition
- #Business Areas
- #Flow
- #Cluster
- #Multidirectional Flow
- #Chain Diagram
- #16:9
- #4-step diagram PowerPoint
- #connected flow diagram slide
- #process flow PowerPoint template
- #arrow diagram slide
- #sequential process visualization
About the Product
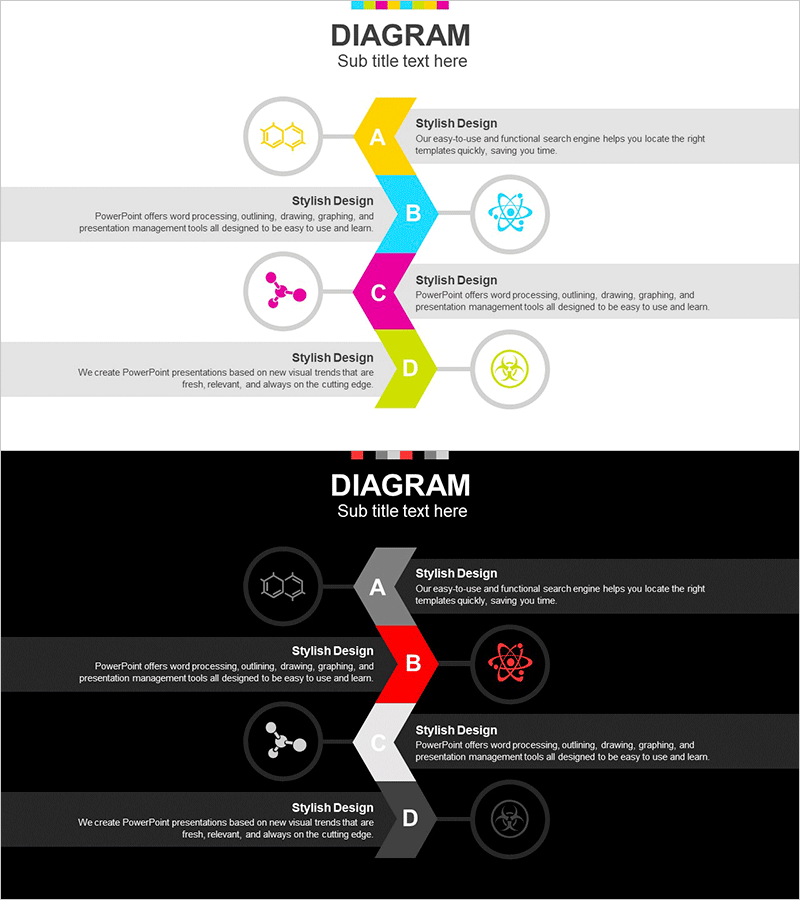
A left-directed flow diagram PowerPoint slide featuring 4 sequential nodes connected by multicolor arrows in yellow, cyan, magenta, and lime green. Each node includes a circular icon placeholder and text area for customization. Two background versions—light gray and dark black—are provided to match any presentation theme. Ideal for visualizing business processes, product development cycles, marketing funnels, organizational structures, and workflow stages. All text, icons, and colors are fully editable for immediate use in corporate presentations, training materials, and strategic planning documents.
Usage Points
-
Main Usage
Clearly illustrates 4 sequential stages or phases using left-directed arrow connections. Perfect for depicting product development pipelines, marketing funnels, organizational hierarchies, business workflows, and cyclical processes in a visually organized manner.
-
How to Use
Replace placeholder text in each step box with your stage titles and descriptions. Swap circular icons with relevant images matching your industry or topic. Select either the light or dark background version to align with your presentation color scheme.
-
Recommended For
Business introductions, product development roadmaps, marketing strategy presentations, organizational structure explanations, training materials, project timelines, and any presentation requiring step-by-step information delivery.
-
Slide Structure
Four nodes (A, B, C, D) connected sequentially by left-pointing arrows. Each node contains a circular icon area and adjacent text box (title + description). Includes two complete layouts: light gray background (top) and dark black background (bottom) for flexible design options.
Related Products
-

Subject Learning Elements Diagram – Visualizing Business Regions and Structure
#Product/Service Introduction #Business Introduction #Diagram
-

Visualizing Business Activities – Innovative Components
#Product/Service Introduction #Business Introduction #Diagram
-

Marketing Segmentation and Targeting Strategy Diagram
#Business Introduction #Marketing Plan and Strategy #Diagram
-

Business Structure Diagram – Visualizing Business Areas
#Product/Service Introduction #Business Introduction #Diagram
