Chemical Experiment Analysis Graph Chart – Visualizing R&D Achievements
RJ0700008_19
- Last Update 07/23/2025
- File Size 1.2MB
- # of Slides 2
- File Format PPTX
- Slide Ratio 16:9
- Color
Keywords
- #Content-Based Slides
- #Design-Based Slides
- #Technical Approach
- #Market and Competitor Analysis
- #Diagram
- #Graph
- #Research and Development
- #Market Analysis
- #Table
- #Horizontal Bar
- #Circles
- #Standard Table
- #Segmented Horizontal Bar
- #Pie Chart
- #16:9
- #pie chart PowerPoint slide
- #2-segment pie graph
- #data ratio visualization
- #R&D analysis chart
- #graph slide template download
About the Product
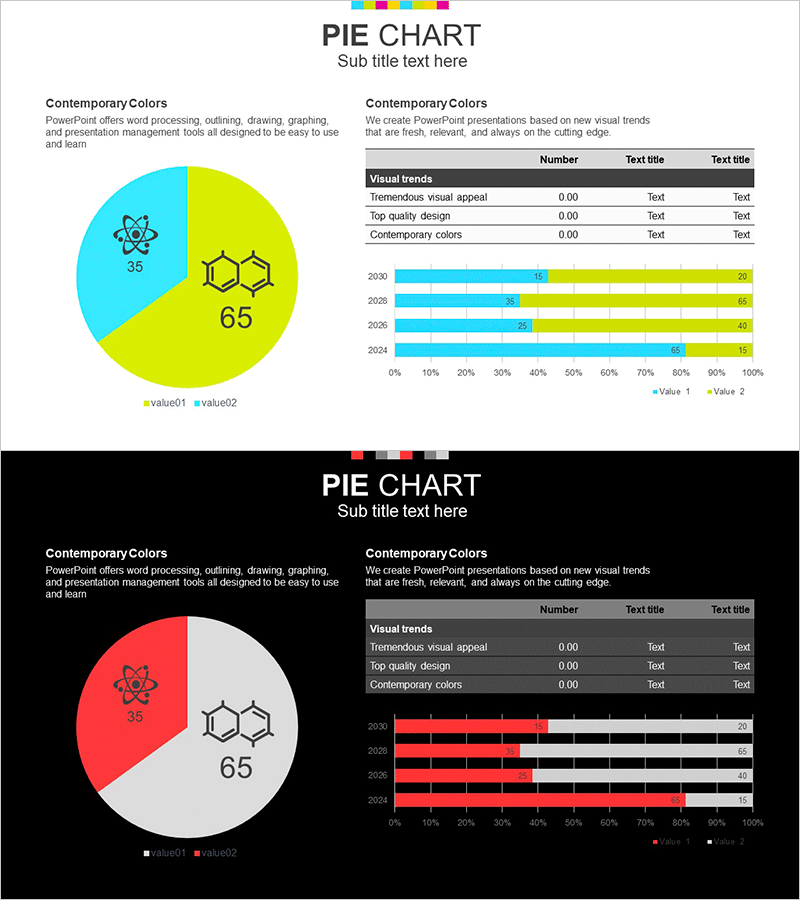
A 2-slide PowerPoint presentation set designed to visualize research and development achievements and analytical data. The pie chart features bright cyan and lime green segments that clearly represent the proportion of two key metrics, while the accompanying stacked bar chart enables year-over-year comparison and trend analysis. This slide deck is ready to use immediately in chemical research reports, scientific studies, technology development presentations, and technical briefings where quantitative performance needs to be emphasized.
Usage Points
-
Main Usage
Quantitatively express research outcomes, experimental analysis results, and technical metrics while enabling stakeholders to grasp proportional relationships at a glance. The pie chart communicates composition ratios while the stacked bar chart conveys temporal trends and performance changes.
-
How to Use
Insert into the data analysis section of scientific and technology reports, research presentations, and technology innovation briefings. Replace pie chart values and legends with actual data, and modify bar chart years and figures to match your presentation context. All elements are fully editable in PowerPoint.
-
Recommended For
Researchers, scientists, technology development teams, quality assurance managers, and data analysts presenting experimental results, technical achievements, and market analysis. Ideal for academic presentations, technology seminars, investor briefings, and situations requiring credible data visualization.
-
Slide Structure
Slide 1: 2-segment pie chart with cyan (35%) and lime green (65%) segments, including icons and legend. Slide 2: Stacked bar chart spanning 2030–2024 (4 years) with Value 1 and Value 2 series, data table, and descriptive text area. All elements are optimized for 16:9 widescreen format.
Related Products
-

Graph Charts for Systematic Market Analysis – Bar and Pie Charts
#Technical Approach #Market and Competitor Analysis #Diagram
-

Science Experiment Analysis Circular Graph Table Chart – Innovation in Data Visualization
#Business Introduction #Technical Approach #Diagram
-

Key Statistics Overview Slide – Market Analysis and Competitive Context
#Market and Competitor Analysis #Diagram #Graph
-

Market Analysis and Financial Performance Visualization with Horizontal Bar Chart and Table
#Market and Competitor Analysis #Financial Plans and Performance #Diagram
