Chemistry Experiment Progress Graph – Visualizing Market Share
RJ0700008_11
- Last Update 07/23/2025
- File Size 1.2MB
- # of Slides 2
- File Format PPTX
- Slide Ratio 16:9
- Color
Keywords
- #Content-Based Slides
- #Design-Based Slides
- #Product/Service Introduction
- #Market and Competitor Analysis
- #Graph
- #Development Status
- #Market Share
- #Horizontal Bar
- #Circles
- #Horizontal Bar Chart
- #Doughnut Chart
- #16:9
- #doughnut chart PowerPoint
- #pie chart slide template
- #horizontal bar graph PPT
- #ratio comparison presentation
- #donut chart download
About the Product
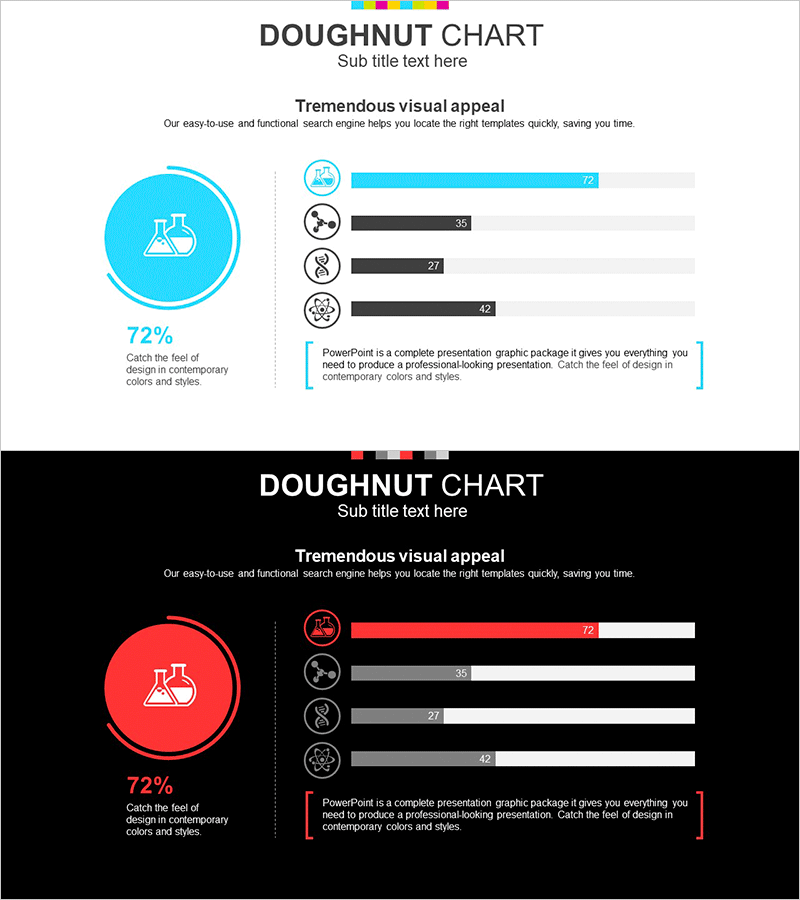
A 2-slide PowerPoint presentation combining a doughnut chart and horizontal bar graph. The left doughnut chart emphasizes a key metric of 72%, while the right side displays four items with detailed values (77, 35, 27, 42) in horizontal bars. Two layout versions are provided: light background and black background, allowing you to choose based on your presentation environment. Icons and text boxes enhance information clarity, making it immediately applicable to market share analysis, experiment progress tracking, sales ratio visualization, and other data comparison scenarios.
Usage Points
-
Main Usage
The doughnut chart emphasizes a key metric (72%) while the horizontal bar graph displays detailed values for four items simultaneously. Perfect for presenting complex data such as market share, experiment progress, sales ratios, and customer satisfaction scores on a single slide.
-
How to Use
Simply replace the doughnut chart's 72% value and the four bar graph values with your own data. Use the light blue background version for general meetings and reports, and the black background version for executive presentations and board meetings. Icons and text boxes are fully editable to clearly label each item.
-
Recommended For
Ideal for marketing analysis reports, sales performance presentations, scientific experiment results, market research presentations, quarterly performance reviews, and customer satisfaction surveys. Recommended for executives, analysts, researchers, and marketing professionals who need data-driven decision-making visuals.
-
Slide Structure
Slide 1: Light background version with doughnut chart (72% emphasis) on the left, four-item horizontal bar graph (77, 35, 27, 42) on the right, four icons, and descriptive text box. Slide 2: Black background version with identical structure, red accent lines, and white text for high contrast.
Related Products
-

Idea Development Status Graph – Clear Data Visualization with Doughnut Chart
#Product/Service Introduction #Market and Competitor Analysis #Graph
-

Analysis of Work Progress – Utilizing Pie Chart
#Product/Service Introduction #Market and Competitor Analysis #Graph
-

City Theme Market Share Graph – Business Data Visualization
#Product/Service Introduction #Market and Competitor Analysis #Graph
-

Development Status Analysis Donut Chart – Market Share Visualization
#Product/Service Introduction #Market and Competitor Analysis #Graph
