Experimental Results Analysis Table – Market and Competitive Analysis
RJ0700008_29
- Last Update 07/23/2025
- File Size 2.5MB
- # of Slides 2
- File Format PPTX
- Slide Ratio 16:9
- Color
Keywords
About the Product
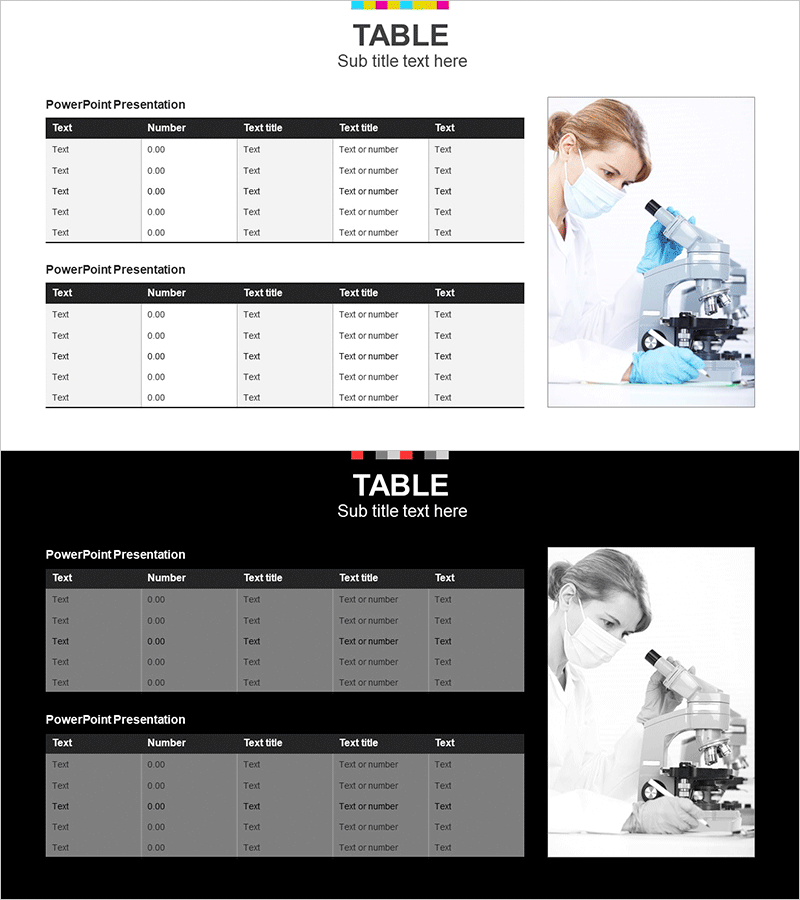
A professional PowerPoint table slide designed for market analysis and competitive comparison presentations. This 2-slide set features a clean white background with black header rows, creating clear information hierarchy and excellent readability. The table structure includes 5 columns and 5 data rows, accommodating numerical data, text information, and comparative metrics simultaneously. A dedicated image area on the right side allows insertion of product photos or supporting visuals. The slides are ready to use in business reports, investor presentations, and analytical decks. Formatted in 16:9 widescreen PPTX for universal compatibility across all devices and platforms.
Usage Points
-
Main Usage
Present quantitative data such as market trends, competitor benchmarks, experimental results, and financial metrics in a structured table format. The black header and white row alternation enhance data clarity and visual hierarchy, while the right-side image area provides visual context.
-
How to Use
Enter text and numerical values into each cell, and insert product images or analysis charts in the right image area. The high contrast between header and data rows automatically emphasizes information structure, maintaining audience focus during presentations.
-
Recommended For
Executive reports, investor pitch decks, market analysis presentations, competitive benchmarking materials, financial analysis slides, experimental result reports, and any data-driven business presentation requiring clear information visualization.
-
Slide Structure
2-slide set with identical layouts for consistent presentation flow. Each slide contains 5 columns (Text, Number, Text title, Text title, Text) and 5 data rows, with a dedicated image insertion area (approximately 200×250px) positioned on the right side.
Related Products
-

Key Competitive Factors in Market Analysis – First Step Toward Competitive Advantage
#Market and Competitor Analysis #Diagram #Graph
-

100% Stacked Column Chart by Subject – Effective Market Analysis
#Market and Competitor Analysis #Diagram #Graph
-

Asia Map and Table Chart – Market Analysis and Marketing Strategies
#Market and Competitor Analysis #Marketing Plan and Strategy #Diagram
-

Industrial Data Report for Market Analysis Slides
#Market and Competitor Analysis #Diagram #Graph
