Chemical Experiment Analysis Horizontal Bar Graph
RJ0700008_7
- Last Update 07/23/2025
- File Size 1.2MB
- # of Slides 2
- File Format PPTX
- Slide Ratio 16:9
- Color
Keywords
- #Content-Based Slides
- #Design-Based Slides
- #Market and Competitor Analysis
- #Graph
- #Competitor Analysis
- #Market Analysis
- #Horizontal Bar
- #Segmented Horizontal Bar
- #16:9
- #100% stacked horizontal bar chart PowerPoint
- #stacked bar graph template
- #data proportion comparison slide
- #year-over-year analysis chart
- #PowerPoint graph slide design
About the Product
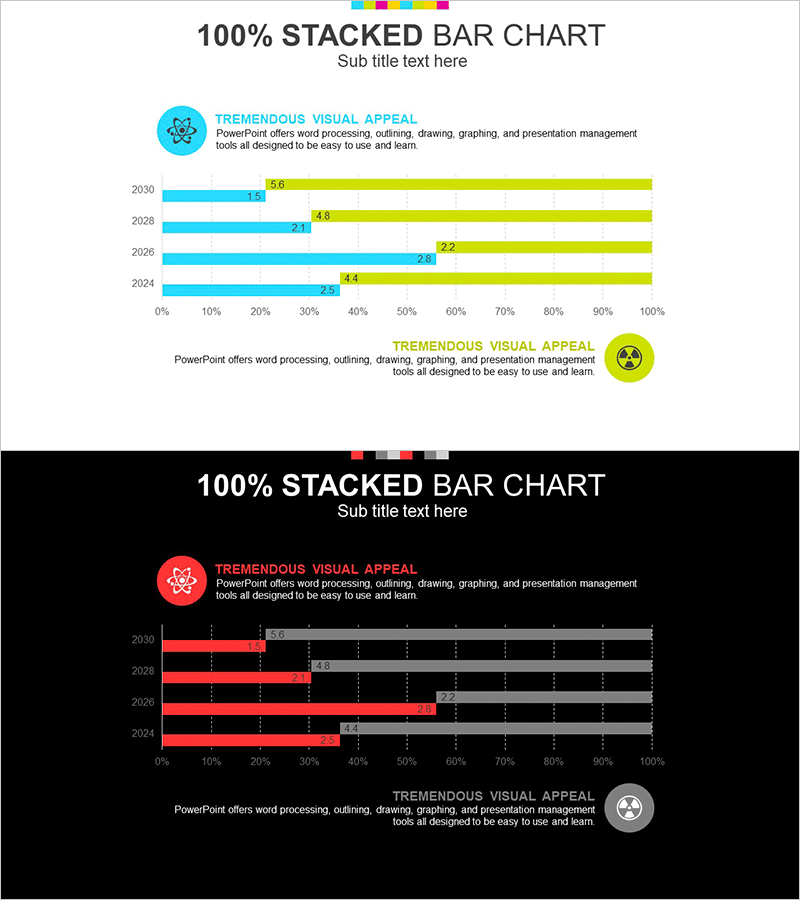
A PowerPoint slide featuring a 100% stacked horizontal bar chart visualizing data across four years from 2024 to 2030. The template includes two design versions: one with a light background and one with a dark background for flexible presentation scenarios. Each bar is divided into two data series using contrasting cyan and yellow-green colors for clear visual distinction. Ideal for chemical experiment analysis, market analysis, competitive analysis, and any presentation requiring proportion comparison. Designed in 16:9 widescreen format with fully editable PPTX elements for seamless customization.
Usage Points
-
Main Usage
Effectively compare the compositional proportions of data across years or categories while showing the relative size of each component against the total. Ideal for displaying chemical reaction product ratios over time, market share evolution, competitive landscape shifts, and any scenario requiring percentage-based comparison visualization.
-
How to Use
Replace the sample data values (1.5, 5.0, 2.1, 4.8) and year labels (2024, 2026, 2028, 2030) with your actual dataset. Select the light background version for daytime presentations and printing, or use the dark background version for evening presentations and video recording. All chart elements are fully editable within PowerPoint.
-
Recommended For
Chemistry and science experiment result reports, marketing team market share analysis presentations, sales team competitive benchmarking, executive briefings, academic seminars, quarterly and annual performance analysis presentations, research findings documentation.
-
Slide Structure
Two-slide template. Each slide contains a title section, descriptive text area, and four horizontal bars representing years (2024, 2026, 2028, 2030). Each bar is divided into two data series (cyan and yellow-green) stacked to 100%, with numerical labels displayed on each segment. Available in both light and dark background color schemes for versatile use.
Related Products
-

Market Analysis Graph Ahead of the Future – Innovative Business Insights
#Market and Competitor Analysis #Diagram #Graph
-

Body Organ Analysis Subdivision Graph - Market and Competitor Comparison
#Market and Competitor Analysis #Graph #Competitor Analysis
-

Segmented Graph of Learning Goal Achievement – Market and Competitor Analysis
#Market and Competitor Analysis #Graph #Competitor Analysis
-

Space Industry Market Analysis Bar Graph – Providing Strategic Insights
#Market and Competitor Analysis #Graph #Competitor Analysis
