Science Experiment Puzzle Diagram – Visually Rich Data Presentation
RJ0700008_4
- Last Update 07/23/2025
- File Size 6.6MB
- # of Slides 2
- File Format PPTX
- Slide Ratio 16:9
- Color
Keywords
- #Content-Based Slides
- #Design-Based Slides
- #Company Introduction
- #Business Introduction
- #Diagram
- #Business Areas
- #Business Areas
- #Cluster
- #Chain Diagram
- #16:9
- #puzzle diagram PowerPoint
- #cluster diagram slide
- #science diagram presentation
- #4-node connection structure
- #data visualization PPT
- #scientific experiment slide template
About the Product
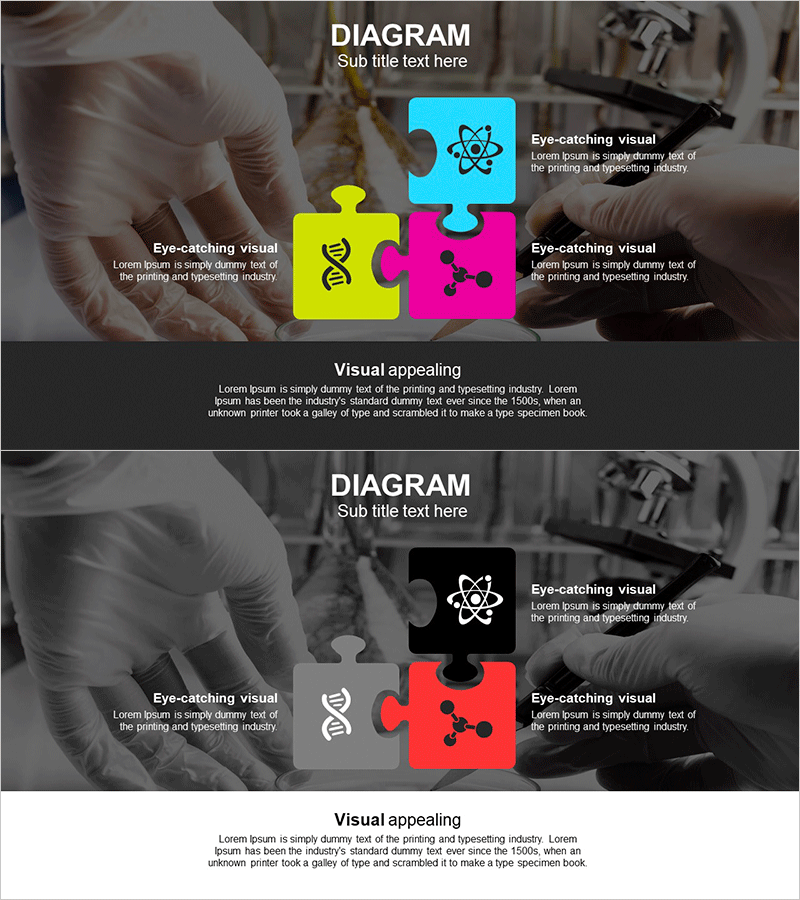
A 4-node puzzle cluster diagram PowerPoint slide designed to visualize scientific experiment data and connection structures. Four colorful puzzle pieces in cyan, yellow, magenta, and black connect to a central atom icon, intuitively representing complex relationships and interactions. Provided in 2-slide format (16:9 aspect ratio) with a bright-tone version and a dark-background version, suitable for both presentations and printed materials. DNA helix icons and molecular structure elements enhance credibility in science, technology, and research fields, making it ideal for introducing company business domains, technology platforms, and collaboration networks.
Usage Points
-
Main Usage
Simplify and visualize complex data relationships and interactions using a 4-node puzzle structure. Enhance credibility in science, technology, and research contexts while clearly communicating scientific concepts through central atom icons and DNA helix elements.
-
How to Use
Apply to company business domain introductions, technology platform components, collaboration network diagrams, and product feature connections by adding text and icons. Select the bright-tone slide for projector presentations and the dark-background version for printed materials and PDF distribution.
-
Recommended For
Recommended for technology presentations in science, technology, medical, pharmaceutical, and IT companies; research institution project structure explanations; startup business model visualizations; and educational institution learning materials. Ideal for executives, technical teams, and marketing teams who need to explain complex concepts intuitively.
-
Slide Structure
2-slide format. Each slide features 4 puzzle nodes (cyan, yellow, magenta, black) arranged around a central atom icon, with text input areas and icon insertion spaces in each node. First slide has a bright background; second slide features a dark background.
Related Products
-

Business Area Overlay Diagram – A Blend of Visual Appeal and Functionality
#Company Introduction #Business Introduction #Diagram
-

Fountain Pen Business Area Diagram – Overview for Business Presentation
#Company Introduction #Business Introduction #Diagram
-

Internet of Things Service Area Diagram – Business Introduction and Visualization
#Company Introduction #Business Introduction #Diagram
-

Core Business Area Diagram – Segmentation and Expansion
#Company Introduction #Business Introduction #Diagram
