
Beer Presentation Template – Eye-Catching Visual Design
J0600043
- Last Update 01/09/2025
- File Size 2.9MB
- # of Slides 35
- File Format PPTX
- Slide Ratio 16:9
- Color
Slide Preview


Keywords
About the Product
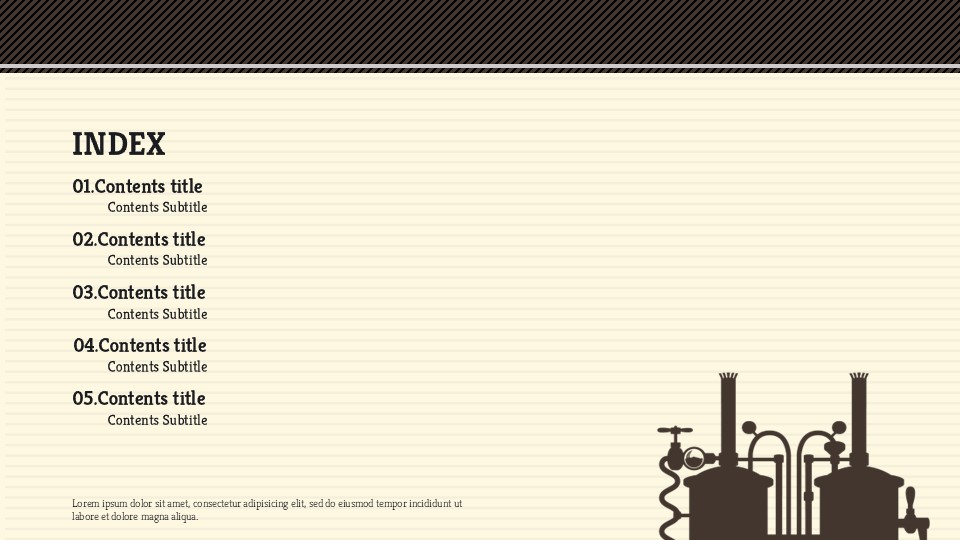
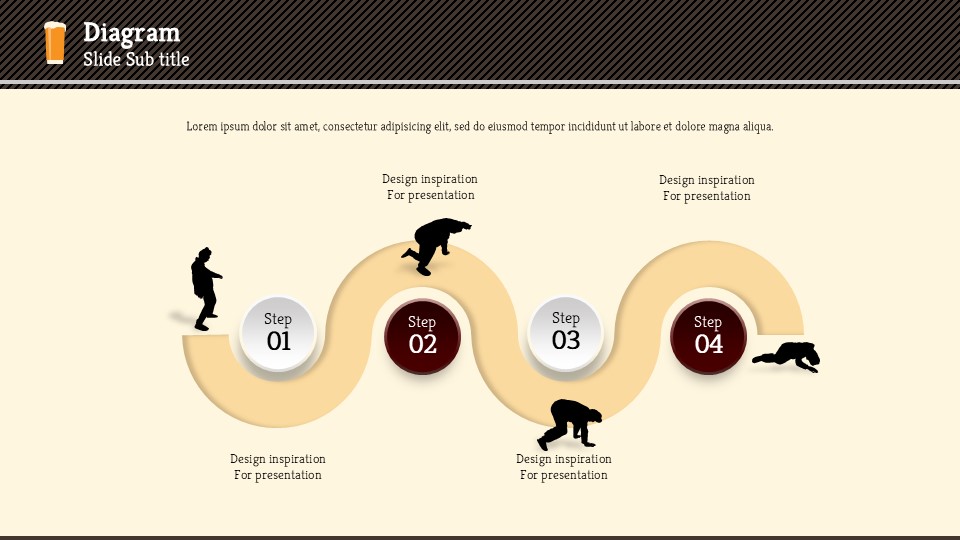
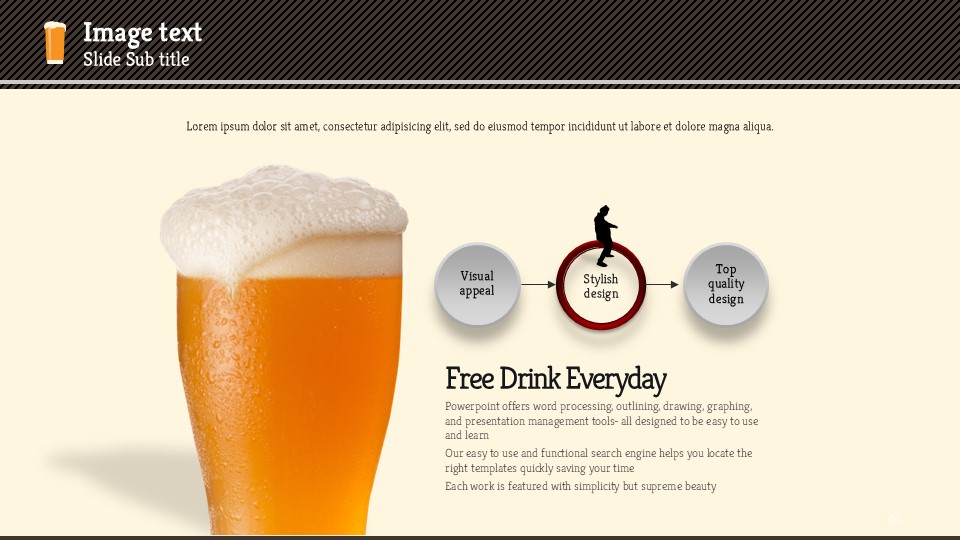
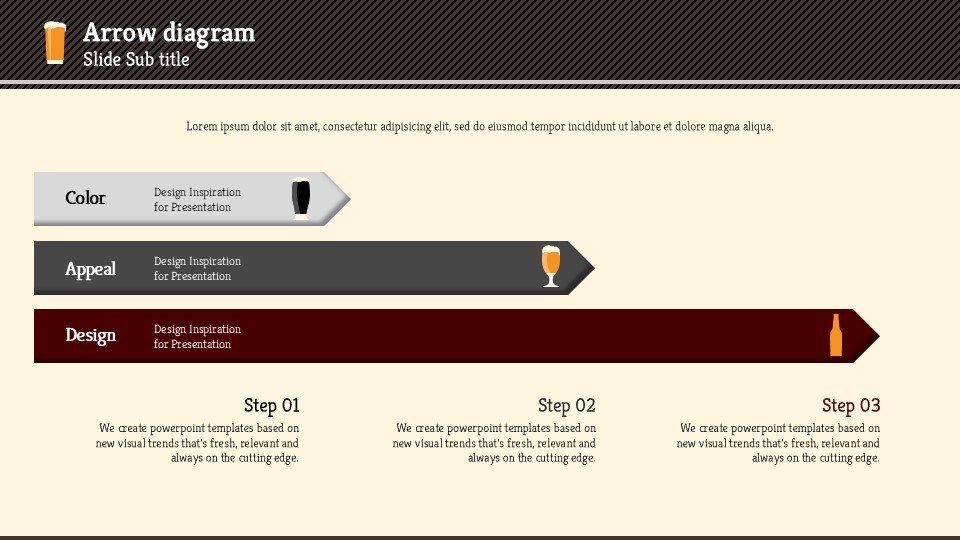
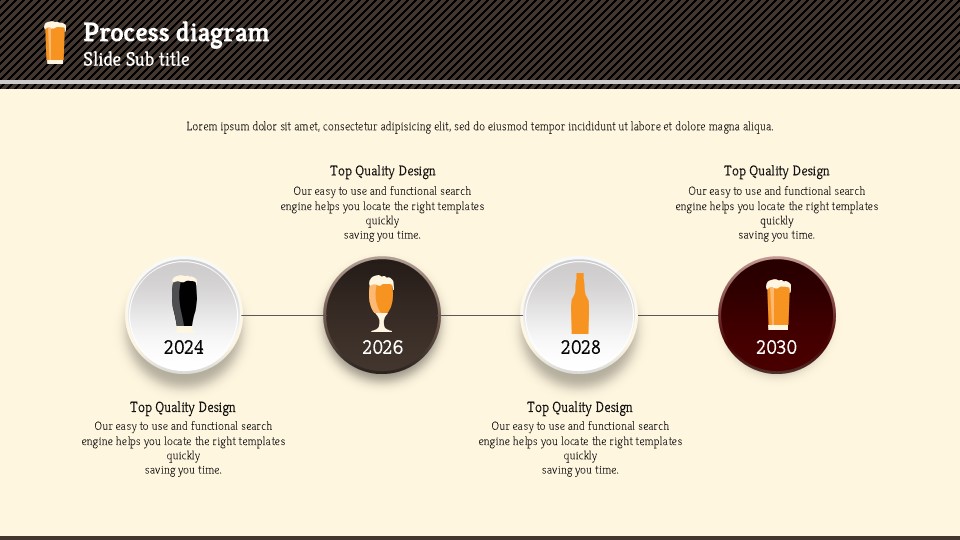
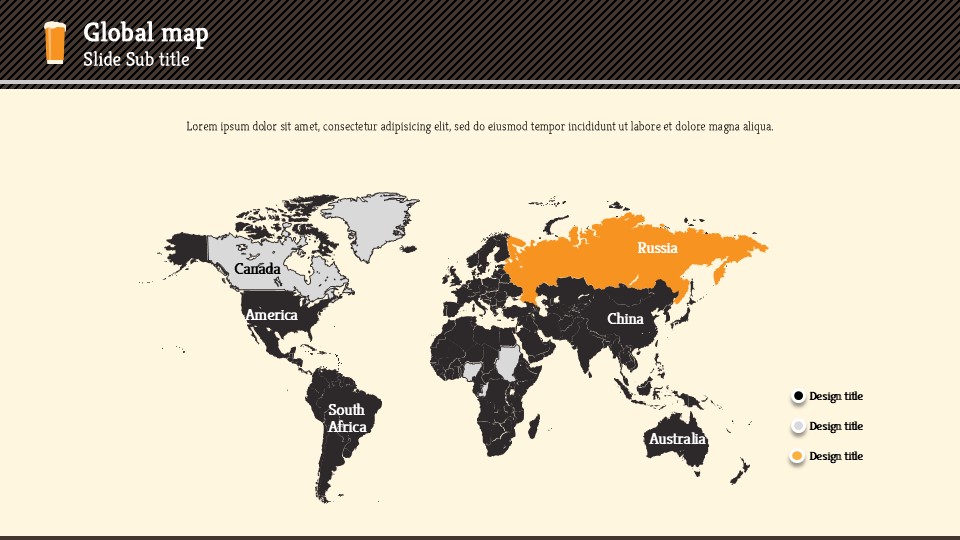
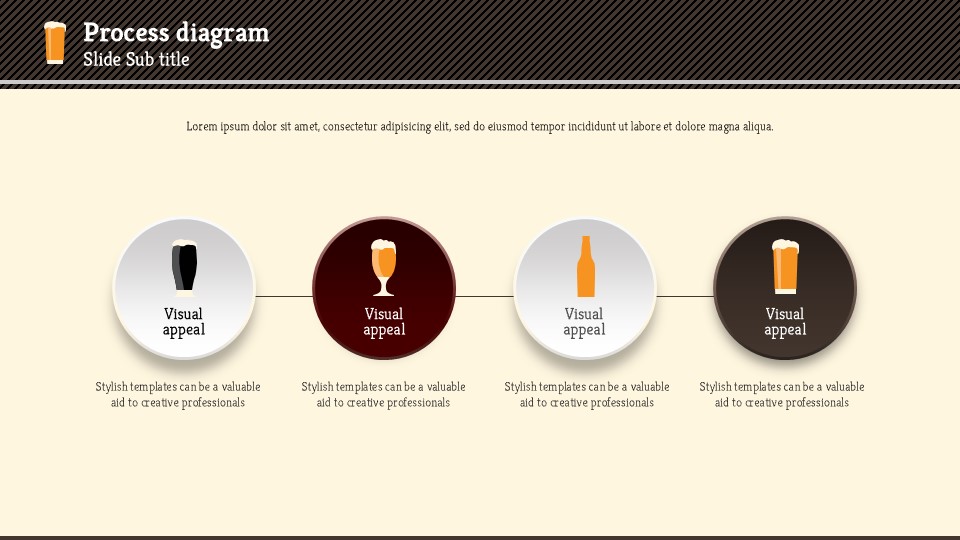
A retro vintage-style PowerPoint template designed for beer, brewery, pub, and food & beverage brand presentations. Built on a cream ivory background with dark brown header bars and amber gold accent colors, this 35-slide PPTX deck delivers a warm, authentic pub aesthetic that sets your brand apart. The template includes a diverse range of slide layouts: a vintage-style title slide featuring clinking beer mug illustrations, image-text combination slides, 4-step wave process diagrams, horizontal arrow diagrams, human silhouette infographics for comparison data, radial circle diagrams, and a timeline slide with circular icons spanning 2024 to 2030. All elements are fully editable in PowerPoint — swap out text, images, and colors to match your brand identity in minutes. Ideal for product launches, brand storytelling, marketing pitches, and investor presentations in the F&B industry. Whether you're presenting a new craft beer line or pitching to investors, this slide deck gives your presentation a professional yet distinctive visual identity.
Usage Points
-
Main Usage
Designed for beer brands, breweries, pubs, and food & beverage companies to present product introductions, brand stories, marketing strategies, and investor pitches with a distinctive retro visual identity.
-
How to Use
Open the PPTX file and replace placeholder text, images, and colors with your brand content. Use the wave process, arrow diagram, and circle diagram slides to visualize product features, brand values, or step-by-step workflows.
-
Recommended For
Recommended for F&B startup founders, brewery and pub operators, beverage brand marketers, food industry investors, and designers preparing brand pitch decks or product launch presentations.
-
Slide Structure
35 slides total: vintage title slide with beer mug illustration, image-text layout, 4-step wave process diagram, 3-step horizontal arrow diagram, 5-column human silhouette infographic, radial circle diagram, and a 4-point circular icon timeline (2024–2030).
Related Products
-

Korea Presentation Wide Template – Harmony of Tradition and Modernity
#Other
-

Nature Beauty PPT Wide – Refreshing Design Capturing Nature for Your Presentations
#Other
-

Suit Presentation Template – Elegant Design and Practicality
#Other
-

Food Truck Presentation Template – Eye-Catching Design to Grab Attention
#Other
