Arrow Diagram of Beer Production Process – Business Strategy
RJ0600043_10
- Last Update 07/02/2025
- File Size 0.2MB
- # of Slides 2
- File Format PPTX
- Slide Ratio 16:9
- Color
Keywords
About the Product
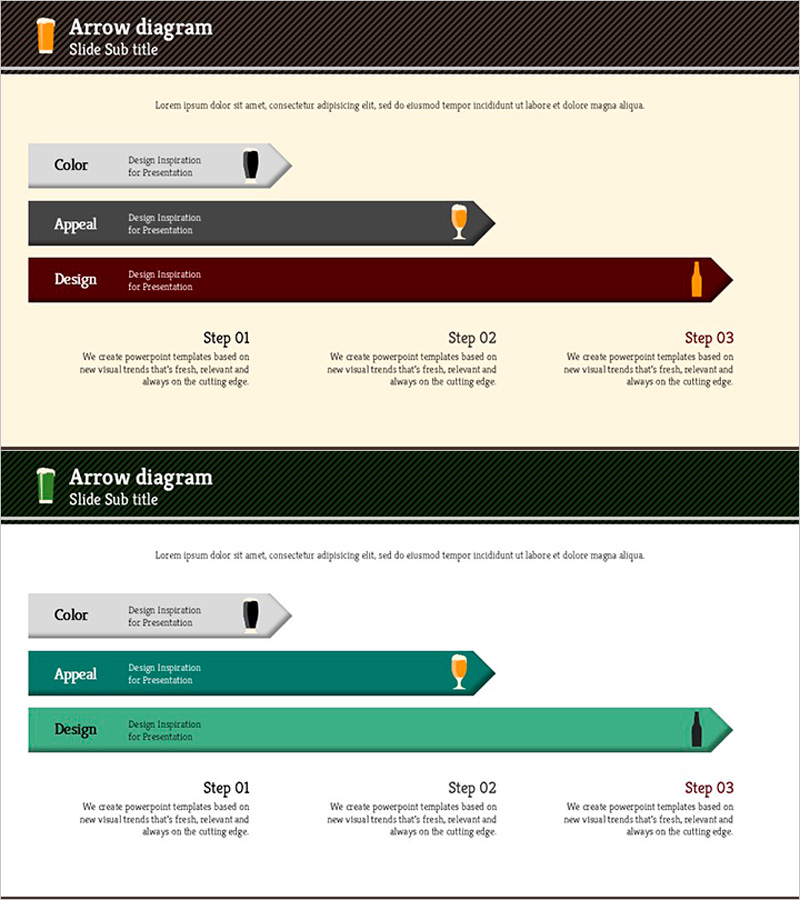
A PowerPoint slide featuring a 3-step arrow diagram to visualize business progression, production processes, or project phases. Each step is color-coded (gray, black, burgundy, and teal versions) for visual distinction, with dedicated explanation areas for each stage and detailed content sections below. This presentation template is ideal for explaining sequential workflows, strategic initiatives, and process flows. Available in 16:9 PPTX format, fully editable and ready to customize.
Usage Points
-
Main Usage
Visualizes 3-stage sequential processes such as business initiatives, production workflows, or project timelines. Color-coded arrows enhance information hierarchy and directional flow, making complex processes immediately understandable to audiences.
-
How to Use
Enter stage titles and descriptions in each arrow box, then populate the Step 01–03 sections below with detailed content. Choose between color schemes (gray-black-burgundy or teal versions) to match your presentation theme and corporate branding.
-
Recommended For
Ideal for executives, project managers, marketers, and strategists presenting business roadmaps, manufacturing processes, campaign timelines, organizational restructuring plans, product launch sequences, and operational workflows.
-
Slide Structure
2-slide set. Each slide contains 3 horizontal arrow nodes with title and description text areas plus icons. Below the arrows, Step 01–03 labels with detailed explanation sections provide space for supporting information and metrics.
Related Products
-

Visualizing Business Strategies with Nature Overlap Diagram
#Business Strategy #Diagram #Production Plan
-

Three-dimensional Box Diagram – Visualization of Business Strategy
#Business Strategy #Diagram #Production Plan
-

Flow Diagram by Meat Type – Emphasizing Business Strategy
#Business Strategy #Diagram #Production Plan
-

5-Step Space Configuration Diagram – Business Strategy
#Business Strategy #Diagram #Production Plan
