The Effects of Alcohol on the Human Body – Understanding Through Visual Flow
RJ0600043_17
- Last Update 07/02/2025
- File Size 0.2MB
- # of Slides 2
- File Format PPTX
- Slide Ratio 16:9
- Color
Keywords
- #Content-Based Slides
- #Design-Based Slides
- #Operational Plan
- #Risk Management and Regulatory Compliance
- #Diagram
- #Risk Management
- # Risk Management Strategy
- #Flow
- #Cluster
- #Linear Flow
- #Inclusive Cluster Diagram
- #16:9
- #overlapping diagram PowerPoint
- #2-node flow diagram slide
- #circular node template
- #relationship diagram PPT
- #process flow PowerPoint slide
- #PowerPoint diagram slide design
About the Product
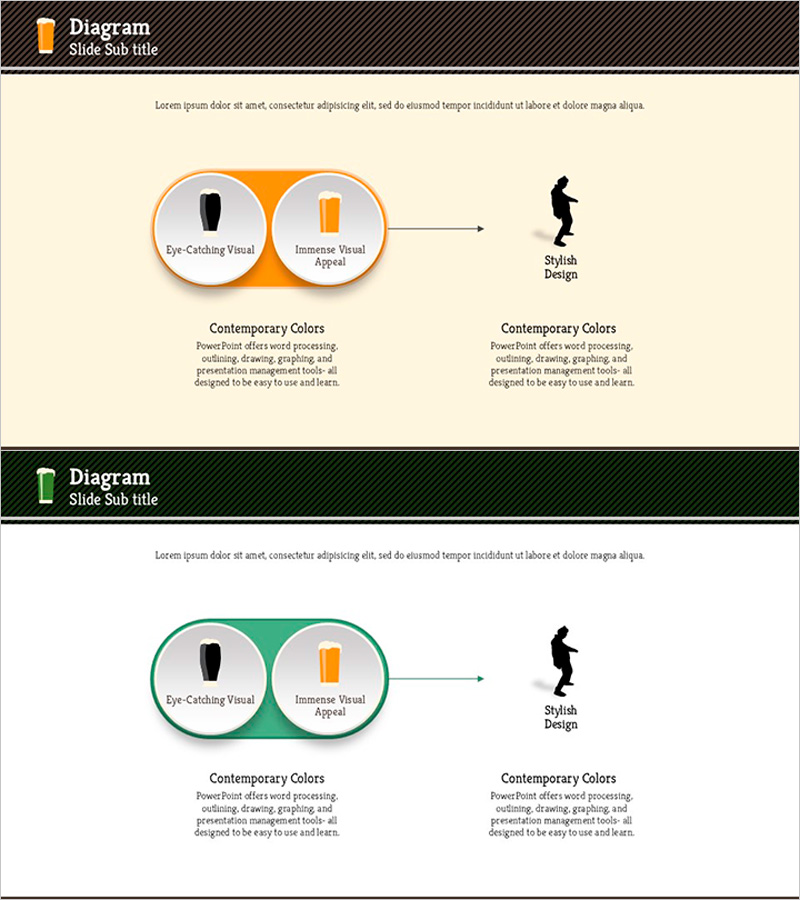
A 2-slide PowerPoint presentation featuring an overlapping diagram design that visually represents the relationship between two elements. Two circular nodes overlap at the center, with an arrow pointing to a final outcome icon on the right. The first slide uses an orange accent color while the second employs a green tone, allowing you to differentiate themes across presentations. Below each diagram is a text area for detailed explanations, making it easy to add context and supporting information. This slide template is ideal for illustrating process flows, combined effects, cause-and-effect relationships, or how two distinct concepts merge into a unified result.
Usage Points
-
Main Usage
Effectively communicate how two concepts, elements, or processes interact, combine, or transform into a final outcome. The overlapping circular nodes intuitively convey relationship and interdependence, while the directional arrow clarifies the logical progression toward the result.
-
How to Use
Enter the first concept name in the left circular node and the second concept name in the right circular node. Fill in the overlapping area and the outcome icon at the arrow's end to complete the cause-and-effect relationship. Add explanatory text in the bottom text area to enhance audience comprehension.
-
Recommended For
Marketing strategy presentations, product development process explanations, organizational change management, educational program planning, risk analysis and mitigation strategies, business model descriptions, and any presentation scenario requiring emphasis on how two elements combine or interact.
-
Slide Structure
Slide 1: Orange dual-tone background. Two circular nodes (approximately 80px diameter) overlap at center, with a rightward arrow and outcome icon. Slide 2: Green dual-tone background with identical overlapping diagram structure but different color scheme. Both slides include a 2-line explanatory text area at the bottom for additional context.
Related Products
-

Green & Gray Template Wide Diagram6
#Business Vision and Strategy #Operational Plan #Diagram
-

Life Tube Diagram for Risk Management Visualization
#Operational Plan #Risk Management and Regulatory Compliance #Diagram
-

Product Introduction Diagram Slide – Clear Skies Begin with Rain and Snow
#Product/Service Introduction #Diagram #Features
-

Issues and Solution Plan Slide Template - An Effective Presentation Tool
#Operational Plan #Diagram #Text Box
