Bottled Beer Donut Chart – Market Share Visualization
RJ0600043_28
- Last Update 07/02/2025
- File Size 0.2MB
- # of Slides 2
- File Format PPTX
- Slide Ratio 16:9
- Color
Keywords
- #Content-Based Slides
- #Design-Based Slides
- #Market and Competitor Analysis
- #Marketing Plan and Strategy
- #Graph
- #Market Share
- #Distribution Strategy
- #Circles
- #Doughnut Chart
- #16:9
- #donut chart PowerPoint
- #pie chart slide template
- #market share visualization
- #two-segment comparison
- #donut graph presentation
- #marketing data slide
About the Product
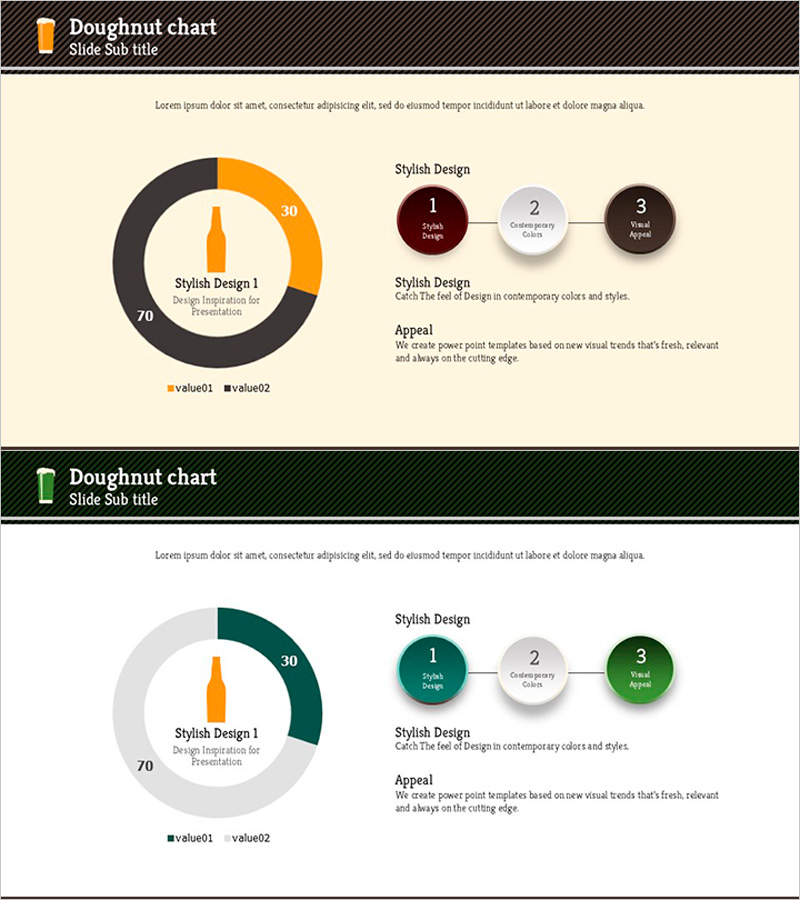
A donut chart PowerPoint slide template designed to visualize market share for bottled beer products. The chart features a two-segment donut ring in orange and dark gray, with a central circular area highlighting key metrics. The right side includes a three-step process diagram with circular nodes in coordinated colors. Presented on a beige background with a dark header bar, this 2-slide template is ready for immediate use in marketing strategy presentations, market analysis reports, and sales performance reviews. Easily editable data fields allow customization for various market comparison scenarios.
Usage Points
-
Main Usage
Visualize market share, sales ratios, and customer segmentation using a donut chart format that emphasizes the relationship between two key segments. The central area highlights critical metrics while the outer donut ring clearly displays proportional composition, enhancing audience comprehension of market dynamics.
-
How to Use
Deploy this slide when presenting competitive market positioning in strategy meetings, comparing product-level revenue distribution in sales reports, or demonstrating customer segment breakdown during investor pitches. Simply update the numerical values and legend labels to apply the template to different market data scenarios.
-
Recommended For
Marketing managers, sales directors, executives, management consultants, and data analysts presenting market analysis, sales performance, and customer composition data. Particularly effective for reports and strategic planning sessions requiring two-item ratio comparisons.
-
Slide Structure
Slide 1: Two-color donut chart (orange and dark gray, 70/30 ratio) with central metrics + three-step circular node diagram on right (node 1 dark red, node 2 light gray, node 3 dark gray). Slide 2: Variant donut chart (orange, dark gray, light gray) + three-step circular node diagram (node 1 dark green, node 2 light gray, node 3 dark green). Both slides feature beige background, dark header bar, and legend labels.
Related Products
-

Watercolor Customer Analysis Donut Chart – Visualizing Market Share
#Market and Competitor Analysis #Graph #Market Share
-

Soccer Match Analysis Chart – Performance Analysis and Future Forecast
#Business Vision and Strategy #Market and Competitor Analysis #Graph
-

Travel Guide Business Goal Market Strategy Donut Chart – Market Share Analysis
#Market and Competitor Analysis #Marketing Plan and Strategy #Graph
-

Avocado Share Chart – Market Status and Competitive Analysis
#Market and Competitor Analysis #Graph #Other
