Beer Carbonated Doughnut Chart – Market Share Analysis
RJ0600043_9
- Last Update 07/02/2025
- File Size 0.3MB
- # of Slides 2
- File Format PPTX
- Slide Ratio 16:9
- Color
Keywords
- #Content-Based Slides
- #Design-Based Slides
- #Market and Competitor Analysis
- #Financial Plans and Performance
- #Graph
- #Market Share
- #Sales and Revenue
- #Circles
- #Doughnut Chart
- #16:9
- #doughnut chart PowerPoint
- #pie chart slide template
- #market share analysis chart
- #4-segment donut chart
- #business data visualization
About the Product
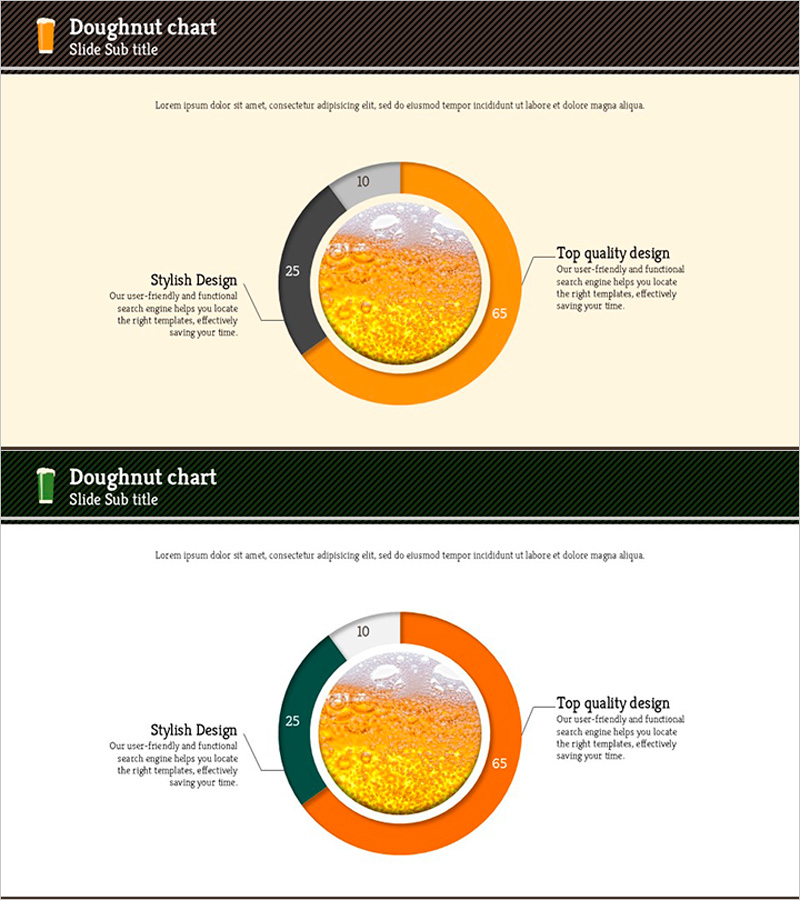
A doughnut chart PowerPoint slide optimized for beer market analysis and market share comparison. The design features an outer ring composed of orange, gray, and green segments alongside a textured yellow circular chart in the center, clearly representing four data points (85, 31, 25, 10). Text description areas are positioned adjacent to each segment, enabling intuitive communication of key messages such as product features, design quality, and user experience. The two-slide set provides color variations (orange-gray vs. orange-green) to ensure presentation diversity. Delivered in 16:9 widescreen PPTX format for immediate use across all presentation environments.
Usage Points
-
Main Usage
Visualizes proportional relationships such as market share, sales ratios, and product composition percentages relative to the whole. The textured circular element at the center of the doughnut serves as a visual focal point, while the color-segmented outer ring clearly distinguishes each category. Perfect for emphasizing key figures in the data sections of financial reports, marketing analyses, and business plans.
-
How to Use
Open the slide and replace the numbers and text labels in each segment with your own data. The orange-gray-green color combination can be customized to match your corporate brand colors. Utilize the two-slide versions to present the same data in different color schemes or to compare proportional changes over time.
-
Recommended For
Recommended for finance teams presenting revenue composition analysis, marketing teams reporting market share, executive presentations of business performance, investor relations materials, and product portfolio analysis. Particularly suitable for direct application in market analysis presentations within the beverage and consumer goods industries.
-
Slide Structure
Each slide comprises a header area (title and subtitle), a central doughnut chart with a 4-segment outer ring and textured center circle, and text description areas on the left and right sides. Data points are displayed as 85, 31, 25, and 10, with descriptive text such as 'Stylish Design' and 'Top Quality Design' positioned adjacent to each segment.
Related Products
-

Visualizing Real Estate Sales Composition with Doughnut Chart – A Tool for Management Analysis
#Market and Competitor Analysis #Financial Plans and Performance #Graph
-

Market Share Donut Graph – Stylish Data Visualization
#Market and Competitor Analysis #Financial Plans and Performance #Graph
-

Car PowerPoint Template Wide - Donut Chart for Market Share Analysis
#Market and Competitor Analysis #Financial Plans and Performance #Graph
-

Donut Chart for Beach Travel – Capture Visual Appeal
#Market and Competitor Analysis #Financial Plans and Performance #Graph
