Liquor Industry Financial Indicators – Effective Data Visualization
RJ0600043_25
- Last Update 07/02/2025
- File Size 0.2MB
- # of Slides 2
- File Format PPTX
- Slide Ratio 16:9
- Color
Keywords
- #Content-Based Slides
- #Design-Based Slides
- #Financial Plans and Performance
- #Diagram
- #Cash Flow Statement
- #Key Financial Indicators
- #Table
- #16:9
- #financial indicators PowerPoint slide
- #financial data table presentation
- #cash flow statement slide
- #income statement PPT
- #financial metrics visualization
About the Product
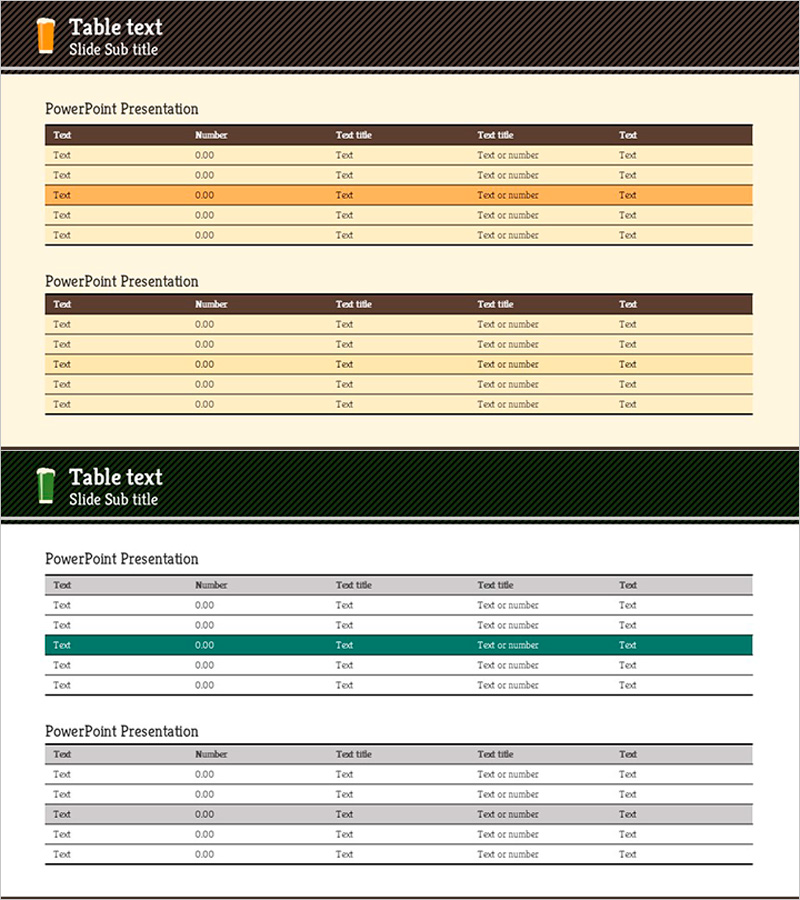
A data table PowerPoint slide designed to clearly communicate financial performance and metrics. This 2-slide set features a brown header and beige background that maximize readability of numerical information. The 5-column structure accommodates number, item name, value, description, and additional data fields, making it ideal for financial indicators, cash flow statements, and income statements. Alternating row colors (orange and green highlights) improve data distinction and visual hierarchy. Perfect for investor presentations, financial reports, business plans, and quarterly earnings announcements where precise financial data visualization is essential.
Usage Points
-
Main Usage
Designed to present financial metrics, cash flow statements, income statements, and financial ratios in a structured format. The brown header and beige background create strong contrast to emphasize data headers, while alternating row colors clearly distinguish information layers.
-
How to Use
Use in investor relations presentations (IR), financial reports, business plans, and quarterly earnings announcements to explain financial performance. Input numerical values, item names, and descriptions in each cell for at-a-glance financial understanding.
-
Recommended For
CFOs, finance managers, investor relations professionals, and executives presenting financial performance. Suitable for industries requiring financial transparency such as liquor manufacturing, industrial production, and financial services.
-
Slide Structure
2-slide set with identical table layouts. Each table contains 5 columns (number, item name, value, description, additional info) and 6 rows. Rows alternate between beige, orange, and green highlighting for clear data distinction and visual organization.
Related Products
-

Effective Note Template Table for Cash Flow Statements
#Financial Plans and Performance #Diagram #Cash Flow Statement
-

Table Chart with Light Background – Financial Planning Tool
#Financial Plans and Performance #Diagram #Cash Flow Statement
-

Teal Table Chart in Sky Template
#Financial Plans and Performance #Diagram #Cash Flow Statement
-

Square Frame Presentation Template for Financial Performance – Efficiency and Clarity
#Financial Plans and Performance #Diagram #Cash Flow Statement
