Visualizing Steps with Rounding Process Diagram
RJ0600043_26
- Last Update 07/02/2025
- File Size 0.2MB
- # of Slides 2
- File Format PPTX
- Slide Ratio 16:9
- Color
Keywords
- #Content-Based Slides
- #Design-Based Slides
- #Business Strategy
- #Diagram
- #Text Box
- #Production Plan
- #Step-by-Step Schedule Plan
- #Cluster
- #Closed Cluster Diagram
- #Rounded Rectangle Text Box
- #16:9
- #rounding rectangle diagram PowerPoint
- #4-step process slide template
- #sequential workflow diagram
- #business process flowchart PPT
- #step-by-step process visualization
About the Product
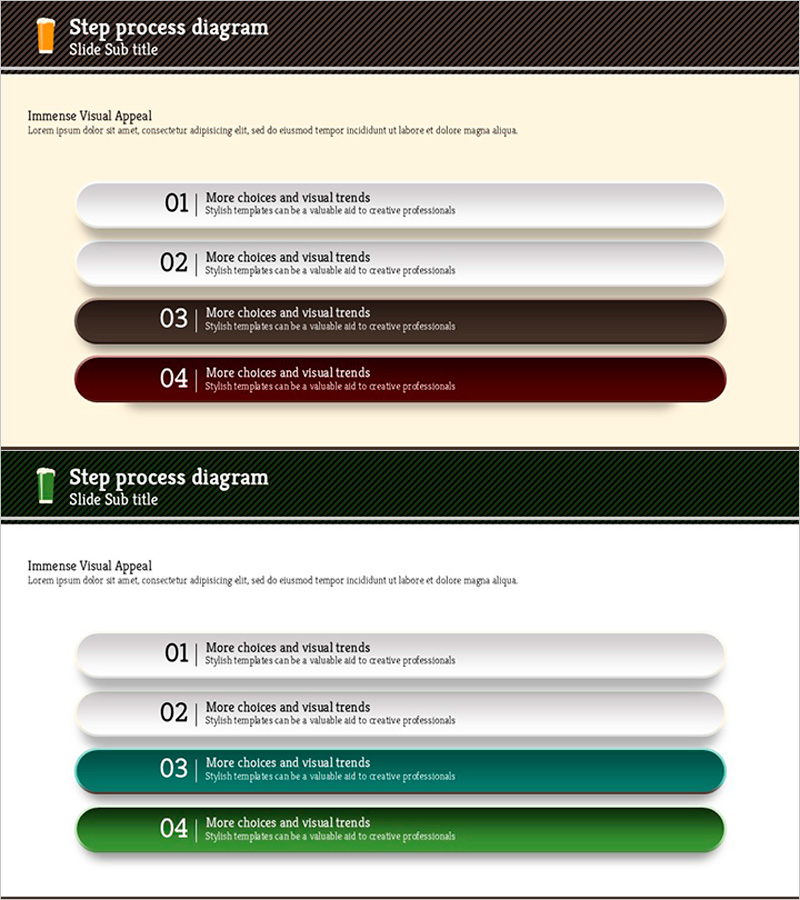
A 4-step rounding rectangle process diagram PowerPoint slide designed to visualize business strategies and sequential workflows. Each rounded box is color-coded in orange, gray, brown, and wine tones with numbered labels and editable text areas for titles and descriptions. This slide template is ideal for presenting project timelines, marketing campaign phases, organizational restructuring, product launch roadmaps, and other multi-stage business processes. Provided as a 2-slide set in 16:9 widescreen format, with fully customizable colors and text fields to match your presentation needs.
Usage Points
-
Main Usage
Clearly visualize 4-stage business processes, project timelines, marketing campaign phases, organizational changes, and product launch roadmaps. Help audiences understand each step's objectives and content through intuitive visual flow.
-
How to Use
Edit the numbered boxes (01–04) with your own titles and descriptions to match your specific process. Customize colors based on priority levels or categories, and add icons to emphasize each stage's characteristics. Insert into presentations, reports, and proposals to make complex workflows easy to understand at a glance.
-
Recommended For
Business strategists, marketing managers, project managers, and executives presenting strategy updates, marketing plans, organizational changes, and product development initiatives. Particularly effective for executive briefings and client proposals requiring clear step-by-step explanations.
-
Slide Structure
2-slide set with 4 rounding rectangle boxes arranged horizontally on each slide. Each box contains a numbered label, title field, and description text area. Slide 1 features orange, gray, brown, and wine colors; Slide 2 uses gray, gray, teal, and green for diverse process representation options.
Related Products
-

Construction Stage Diagram – Visualizing Business Strategies
#Business Strategy #Diagram #Production Plan
-

Preparation Stage for Interior Work - Cluster Diagram for Business Strategy
#Business Strategy #Diagram #Production Plan
-

Speech Concept: Item Diagram Slide Template – Business Strategy Presentation
#Product/Service Introduction #Business Strategy #Diagram
-

Design Slide Ideal for Storage Product Introduction – Innovation and Efficiency
#Business Strategy #Diagram #Production Plan
