Pie Chart for Beer Market Share - Ideal for Market Analysis
RJ0600043_15
- Last Update 07/02/2025
- File Size 0.2MB
- # of Slides 2
- File Format PPTX
- Slide Ratio 16:9
- Color
Keywords
- #Content-Based Slides
- #Design-Based Slides
- #Company Introduction
- #Market and Competitor Analysis
- #Graph
- #Key Achievements
- #Market Share
- #Circles
- #Pie Chart
- #16:9
- #pie chart PowerPoint slide
- #market share chart template
- #4-segment pie chart
- #ratio visualization slide
- #business analysis PowerPoint
- #percentage distribution slide
About the Product
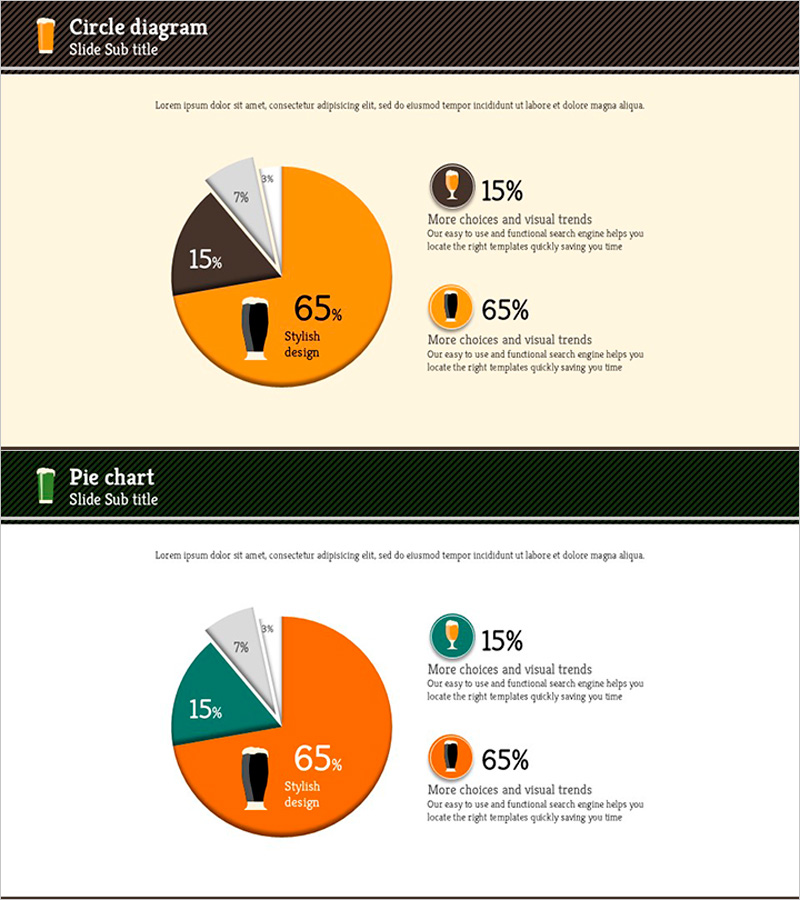
A 4-segment pie chart PowerPoint slide visualizing market share distribution with orange, black, and gray color coding. The design emphasizes the primary segment (65%) while clearly displaying secondary segments (15%, 9%, 7%) for intuitive ratio comparison. This 2-slide set is optimized for market analysis presentations, business reports, and sales performance reviews. The first slide features a centered pie chart with percentage labels, while the second slide includes icon-based callouts for detailed explanation. All elements are fully editable in PowerPoint for custom data integration.
Usage Points
-
Main Usage
Visualize proportional relationships such as market share, sales composition, budget allocation, and customer distribution. The design highlights the dominant segment (65%) while maintaining clear visual hierarchy for secondary segments, making it ideal for executive presentations and investor briefings.
-
How to Use
Slide 1 presents a centered pie chart with percentage values displayed directly on segments. Slide 2 uses the same chart with icon-based callouts positioned on the right for detailed narrative explanation. Modify data values and colors using PowerPoint's built-in chart editing tools without affecting the overall design structure.
-
Recommended For
Marketing managers, executives, business analysts, and sales teams presenting quarterly results, competitive analysis, customer segmentation, budget breakdown, and product performance metrics. Suitable for board meetings, investor presentations, and strategic planning sessions.
-
Slide Structure
2-slide set in 16:9 widescreen format (PPTX). Slide 1: Centered 4-segment pie chart (65%, 15%, 9%, 7%) with icon callouts on the right. Slide 2: Same chart with two text explanation boxes for detailed segment descriptions. All chart elements, colors, and text are fully editable.
Related Products
-

Sensuous Cloud Presentation Template Pie Chart1 – Visualizing Market Share
#Company Introduction #Market and Competitor Analysis #Graph
-

Pie Chart of Composition Ratio by Fashion Type – The Start of Data Visualization
#Company Introduction #Market and Competitor Analysis #Diagram
-

Orange Hexagon Pie Chart Template – Market Share Analysis
#Company Introduction #Market and Competitor Analysis #Graph
-

Three Key Performance Pie Charts – Visualization of Performance Analysis
#Company Introduction #Market and Competitor Analysis #Graph
