Results of Preference Survey by Beer Product – Utilizing Horizontal Bar Graph
RJ0600043_7
- Last Update 07/02/2025
- File Size 0.2MB
- # of Slides 2
- File Format PPTX
- Slide Ratio 16:9
- Color
Keywords
- #Content-Based Slides
- #Design-Based Slides
- #Business Strategy
- #Financial Plans and Performance
- #Graph
- #Achievements
- #Sales and Revenue
- #Horizontal Bar
- #Horizontal Bar Chart
- #16:9
- #horizontal bar chart PowerPoint
- #bar graph slide template
- #data comparison chart
- #numerical data visualization
- #market research presentation slide
About the Product
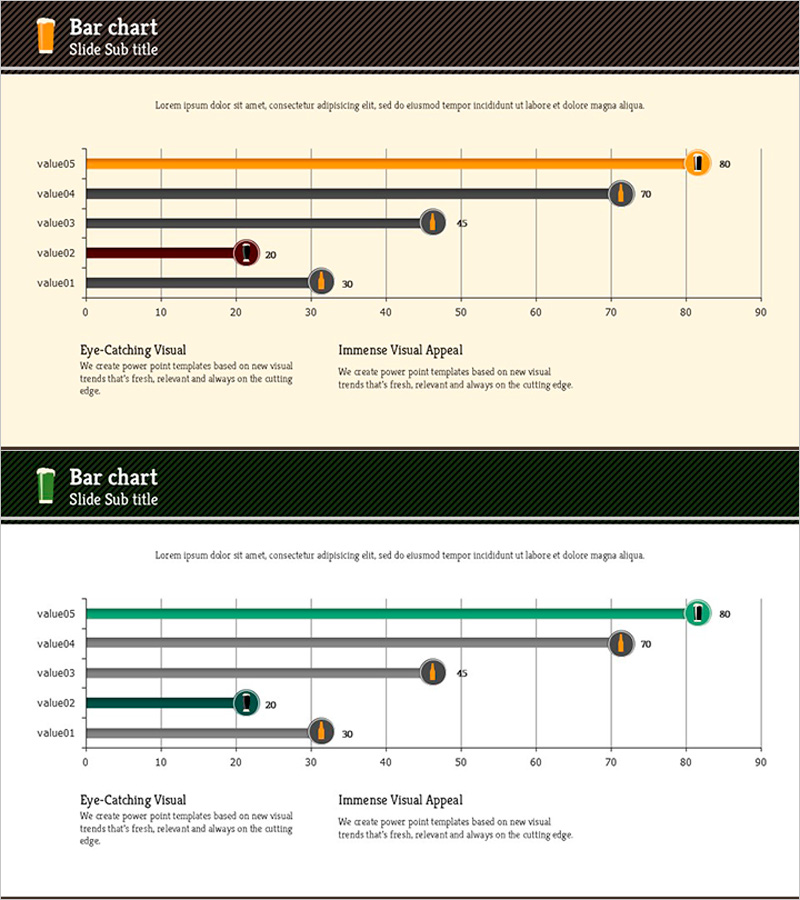
A PowerPoint slide template featuring a horizontal bar chart to visualize numerical data across five items. The design uses orange, dark brown, black, and gray tones to create a professional appearance ideal for market research, preference analysis, and sales performance comparisons. Each bar is labeled with a circular icon and numerical value at the end, enhancing data readability. Grid lines support accurate value comparison. The 2-slide set in 16:9 widescreen format enables presentation of multiple datasets and is ready for immediate use in business presentations and reports.
Usage Points
-
Main Usage
Displays numerical data across five items for market research, preference surveys, sales performance, and competitive analysis. The bar length intuitively represents relative magnitude, while circular icons and numerical labels ensure accurate value communication.
-
How to Use
Insert into the analysis results section of business reports, marketing plans, and strategy presentations. Edit the bar lengths, values, and labels to match your data. Customize colors, icons, and fonts to align with your company's brand guidelines.
-
Recommended For
Marketing teams, sales departments, executives, consultants, and research analysts use this template to present market data, customer preferences, and product performance to stakeholders. Particularly effective for product-by-product, regional, and time-based comparisons.
-
Slide Structure
2-slide set. Each slide contains a horizontal bar chart with 5 data items, X-axis grid (0–90 range), 5 data series (value01–value05), circular icons and numerical labels at bar ends, and descriptive text area at bottom. Two color variations (orange and green tones) provided for design flexibility.
Related Products
-

Revenue Breakthrough: Achieving All-Time Highs with Bar Graphs
#Business Strategy #Financial Plans and Performance #Graph
-

Striking Performance Gap in Agricultural Outcomes
#Business Strategy #Financial Plans and Performance #Graph
-

Furniture Sales Performance Graph – Business Strategy Achievement
#Business Strategy #Financial Plans and Performance #Graph
-

Popular Snack Graph for Revenue Visualization – Simplicity and Intuition
#Business Strategy #Financial Plans and Performance #Graph
