Product Introduction Through Process Visualization - The Process of Getting Drunk
RJ0600043_5
- Last Update 07/02/2025
- File Size 0.6MB
- # of Slides 2
- File Format PPTX
- Slide Ratio 16:9
- Color
Keywords
- #Content-Based Slides
- #Design-Based Slides
- #Product/Service Introduction
- #Business Strategy
- #Diagram
- #Differentiation Strategy for Products/Services
- #Production Plan
- #Flow
- #Linear Flow
- #16:9
- #linear process diagram PowerPoint
- #3-step arrow slide template
- #product introduction presentation
- #business strategy diagram
- #process visualization slide download
About the Product
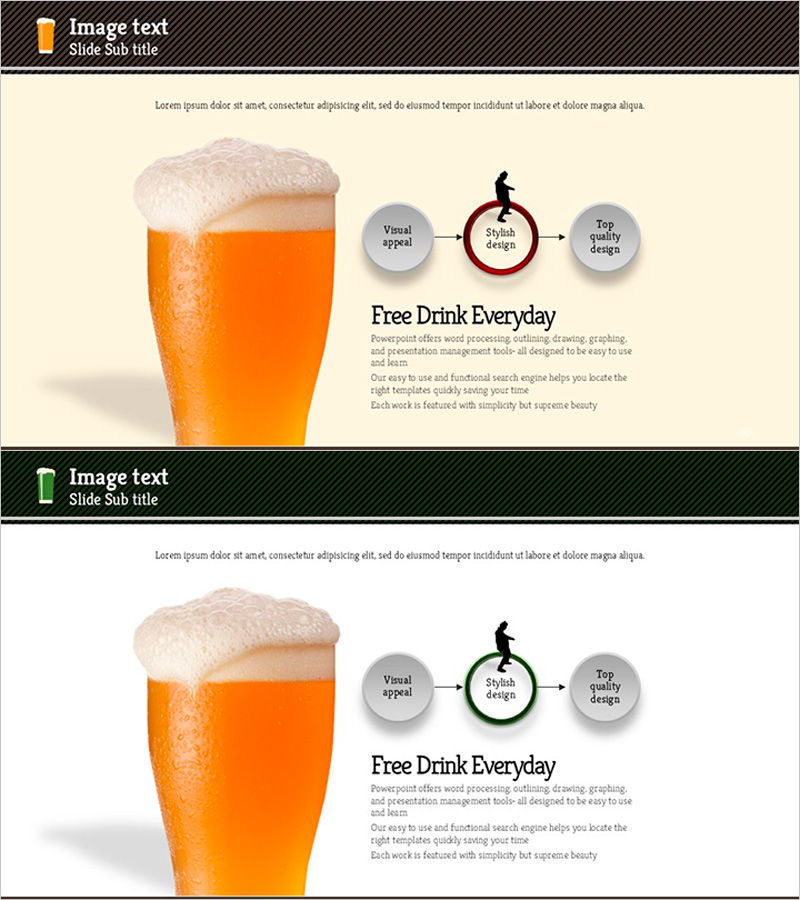
A 3-step linear process diagram PowerPoint slide designed to visualize product introduction and business strategy execution. Features gray circular nodes connected by orange and wine-colored directional arrows that clearly represent sequential workflow. The 2-slide set includes identical layouts with color variations, allowing you to select the version that best fits your presentation context. The balanced composition of left-side imagery and right-side text area effectively communicates product features and competitive differentiation. Fully editable PPTX format suitable for corporate presentations, marketing plans, and product introduction materials.
Usage Points
-
Main Usage
Illustrates a 3-phase workflow such as product development-launch-marketing or customer journey stages. Each phase is represented by a circular node with connecting arrows emphasizing linear progression. Ideal for explaining product features, business execution strategies, and competitive advantages.
-
How to Use
Place product imagery or key visual content on the left side, then input phase names and descriptions into the 3-step diagram on the right. Edit node text and arrow labels to match your specific process flow. Choose between two color versions based on your presentation theme and brand guidelines.
-
Recommended For
Product managers, marketing professionals, business development specialists, and executives preparing strategy presentations. Effective for startup pitches, corporate seminars, internal briefings, and stakeholder communications requiring process-based product narratives.
-
Slide Structure
2-slide set with 16:9 aspect ratio. Each slide divides into left image area (approximately 40%) and right content area (approximately 60%). The right section displays 3 gray circular nodes arranged left-to-right, connected by orange or wine-colored directional arrows. Each node includes a silhouette icon above and text input field below for customization.
Related Products
-

Experimental Research Promotion System Diagram
#Product/Service Introduction #Business Strategy #Diagram
-

Medical Business Linear Diagram – Visualizing Business Strategy
#Business Strategy #Diagram #Production Plan
-

Coffee Bean Type Inclusion Diagram
#Product/Service Introduction #Diagram #Composition
-

Differentiated Promotion Strategy Presentation Template – Emphasizing Marketing and Innovation
#Product/Service Introduction #Marketing Plan and Strategy #Diagram
