Beer Tree Structure Chart – A New Paradigm of Data Visualization
RJ0600043_12
- Last Update 07/02/2025
- File Size 0.2MB
- # of Slides 2
- File Format PPTX
- Slide Ratio 16:9
- Color
Keywords
- #Content-Based Slides
- #Design-Based Slides
- #Product/Service Introduction
- #Technical Approach
- #Diagram
- #Composition
- #Service Architecture Diagram
- #Structure
- #Cluster
- #Tree Diagram
- #Closed Cluster Diagram
- #16:9
- #closed cluster diagram PowerPoint
- #3-node structure chart slide
- #hierarchical diagram template
- #organizational structure PPT
- #icon-based diagram presentation
About the Product
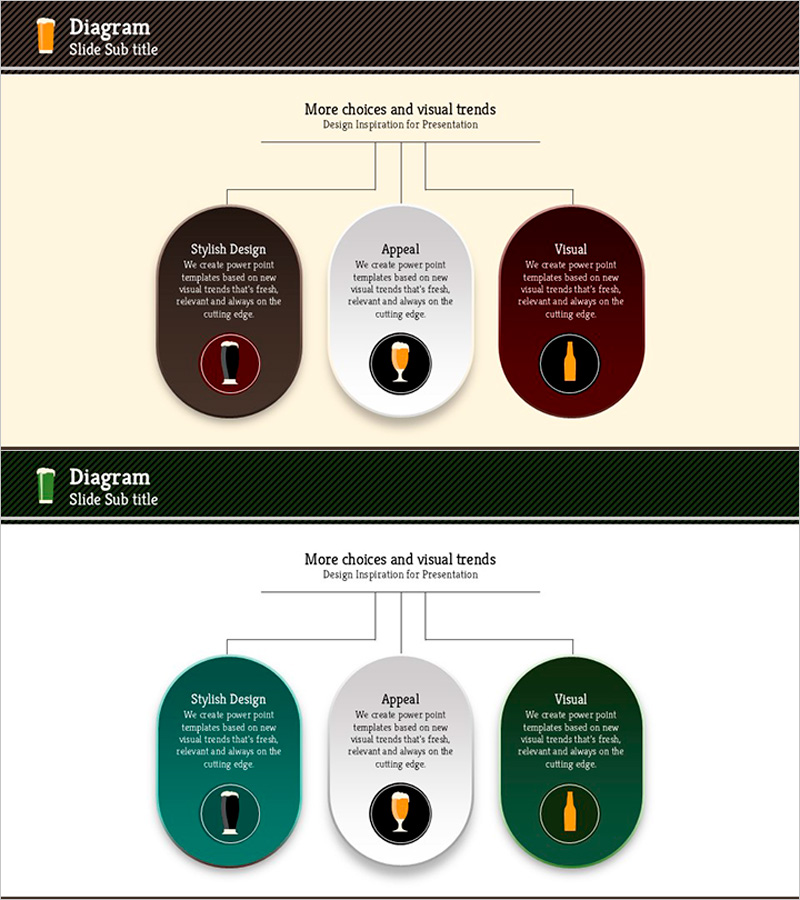
A closed-cluster diagram PowerPoint slide that presents three key elements in a hierarchical structure. The design features a horizontal connector line at the top center that branches into three oval-shaped nodes, each distinguished by color: dark charcoal, light gray, and wine red. The central node uses a lighter tone to create visual hierarchy, while the side nodes employ darker shades for contrast. Each node contains an icon area and text field, making it ideal for presenting service structures, organizational hierarchies, product categories, or business model components. The two-slide set includes color variations in orange and green palettes to match your presentation theme. Delivered in 16:9 widescreen PPTX format for immediate editing and deployment.
Usage Points
-
Main Usage
Visually represents three core elements or categories in a hierarchical relationship, clarifying how different components interact within a system. Ideal for illustrating service offerings, organizational divisions, product lines, or business model pillars in a way that enhances audience comprehension.
-
How to Use
Apply in company profile presentations to showcase business domains, product launches to explain category-specific features, organizational structure explanations, and marketing plans for audience segmentation. Customize node text and icons to align with your specific context and messaging.
-
Recommended For
Business strategy presentations, product portfolio introductions, and organizational structure explanations for executives, managers, and marketing teams. Recommended for startup investor pitches, consulting proposals, and educational seminars where three-axis business explanation is required.
-
Slide Structure
Horizontal connector line at top center branches into three oval nodes: left node (dark charcoal), center node (light gray), right node (wine red). Each node contains a circular icon area and text input space. Two-slide set with color variations in orange and green palettes for theme flexibility.
Related Products
-

Tree Structure in Natural Background – System Diagram
#Technical Approach #Diagram #Service Architecture Diagram
-

Orange & Blue Structure Diagram
#Technical Approach #Diagram #Service Architecture Diagram
-

Button Organization Chart for Effective Team Introduction
#Product/Service Introduction #Diagram #Product/Service Introduction
-

Men's Styling Item Recommendation – Contemporary Vibe
#Product/Service Introduction #Technical Approach #Diagram
