Alcohol Intake Silhouette – Infographic Slide
RJ0600043_13
- Last Update 07/02/2025
- File Size 0.2MB
- # of Slides 2
- File Format PPTX
- Slide Ratio 16:9
- Color
Keywords
- #Content-Based Slides
- #Design-Based Slides
- #Business Strategy
- #Marketing Plan and Strategy
- #Other
- #Marketing Objectives
- #Silhouette
- #Project Progress
- #16:9
- #alcohol intake PowerPoint slide
- #silhouette infographic presentation
- #5-step comparison slide
- #health campaign PPT
- #data visualization PowerPoint template
About the Product
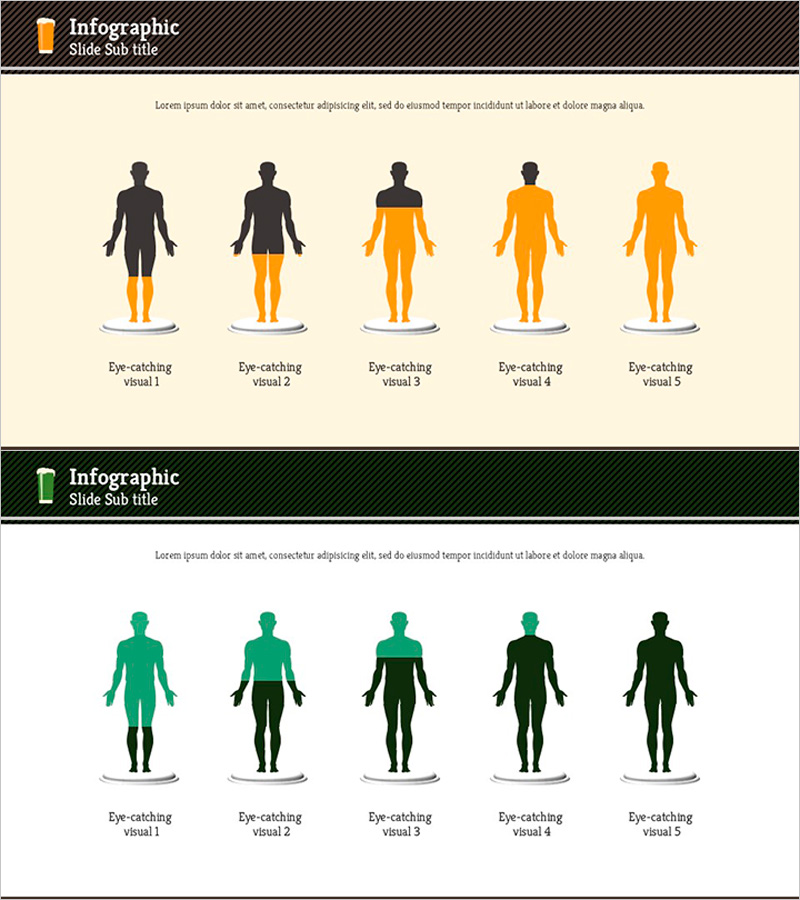
A PowerPoint slide that visualizes alcohol intake levels through 5-step human silhouette infographics. The design uses a two-tone color scheme of black and orange to represent consumption stages, with label areas below each figure for clear categorization of intake levels or target groups. Provided in 2-slide format with 16:9 widescreen ratio, this presentation template effectively communicates data comparison and step-by-step classification in marketing materials, health campaigns, and business reports. Text input areas are ready for immediate customization.
Usage Points
-
Main Usage
Optimized for classifying and visually comparing alcohol consumption levels or health stages across 5 categories. The silhouette infographic transforms abstract data into intuitive visual representation, ideal for marketing campaigns, health education, and business analysis to clearly show audience segmentation or phased progress.
-
How to Use
Enter consumption levels (e.g., low, medium, high) or target groups (e.g., youth, adults, seniors) in the label areas below each silhouette. Maintain the black and orange color scheme or customize colors as needed. Add text boxes for additional descriptions. The 16:9 widescreen format is optimized for large-screen presentations.
-
Recommended For
Healthcare, medical, marketing, and business analysis professionals who need to express data comparison and step-by-step categorization. Particularly useful for consumer behavior analysis, health campaigns, product positioning, and organizational progress reporting where a 5-stage comparison structure is required.
-
Slide Structure
2-slide format with title area at top and 5 silhouette infographics in center. Each figure uses black and orange two-tone coloring with editable label areas below. Well-balanced white space and grid structure facilitate easy text and data input.
Related Products
-

Effort and Challenge Silhouette Diagram – Marketing Strategy Representation
#Business Strategy #Marketing Plan and Strategy #Diagram
-

Modern Business Doughnut Chart Template – Visualizing Marketing Strategies
#Marketing Plan and Strategy #Graph #Other
-

Purple Circle Flow Diagram – Visually Enhance Business Strategy
#Business Strategy #Marketing Plan and Strategy #Diagram
-

Simple & Modern Donut Chart PowerPoint – Essential for Business Strategy Development
#Business Strategy #Marketing Plan and Strategy #Graph
