Beer Process Diagram – Effective Visual Presentation
RJ0600043_24
- Last Update 07/02/2025
- File Size 0.2MB
- # of Slides 2
- File Format PPTX
- Slide Ratio 16:9
- Color
Keywords
About the Product
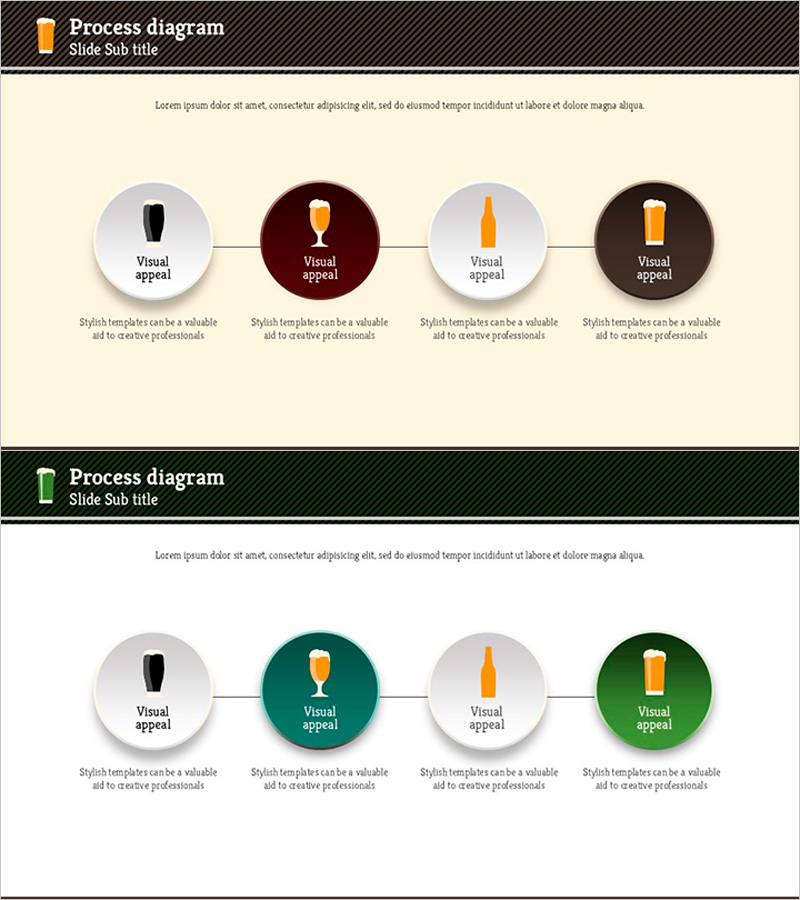
A PowerPoint slide that visualizes product manufacturing processes, service workflows, and business operations through a 4-step circular structure. The design features a beige background with orange, burgundy, and black accent colors, using circular nodes and connecting lines to clearly represent each stage of progression. Each step includes dedicated icon and text description areas for easy information input, making it immediately applicable to process sections in presentations, proposals, and business plans. The 2-slide set offers two color combinations (orange & burgundy accents vs. green & black accents) that can be customized to match your document's tone and branding.
Usage Points
-
Main Usage
Visualize product manufacturing stages, service delivery workflows, or business operational processes in a step-by-step format to enhance audience comprehension. Clearly communicate the role and relationships between each stage, supporting decision-making and process improvement discussions.
-
How to Use
Insert into the 'Service Structure' or 'Operational Process' section of proposals, business plans, or product presentations. Customize each node's icon to match your industry, input stage names and descriptions in the text areas, and select one of the two color combinations to align with your document's brand colors.
-
Recommended For
Manufacturing, food & beverage, chemical, and construction companies explaining production processes; IT and software development teams visualizing development stages; consulting and service firms mapping customer journeys; marketing teams presenting campaign execution phases.
-
Slide Structure
Each slide contains a title and subtitle area, four circular nodes (each with icon, text label, and description text), and connecting lines. Nodes are positioned at top-left, top-right, bottom-right, and bottom-left to represent circular flow, with 2-3 lines of descriptive text space below each node.
Related Products
-

Problem Definition PowerPoint Slide – 4-Step Flow Diagram
#Company Introduction #Business Strategy #Diagram
-

Customer Reviews PowerPoint Slide – Photo Grid Speech Bubble
#Customer Success Stories #Text Box #Customer Testimonials and Feedback
-

Procurement Table PowerPoint Slide – Item Photo Budget Dark
#Product/Service Introduction #Financial Plans and Performance #Features
-

Plastic Waste Emission PowerPoint Slide – Donut Chart
#Market and Competitor Analysis #Corporate Social Responsibility #Graph
