Process Diagram of Beer Evolution – Business Strategy
RJ0600043_11
- Last Update 07/02/2025
- File Size 0.2MB
- # of Slides 2
- File Format PPTX
- Slide Ratio 16:9
- Color
Keywords
About the Product
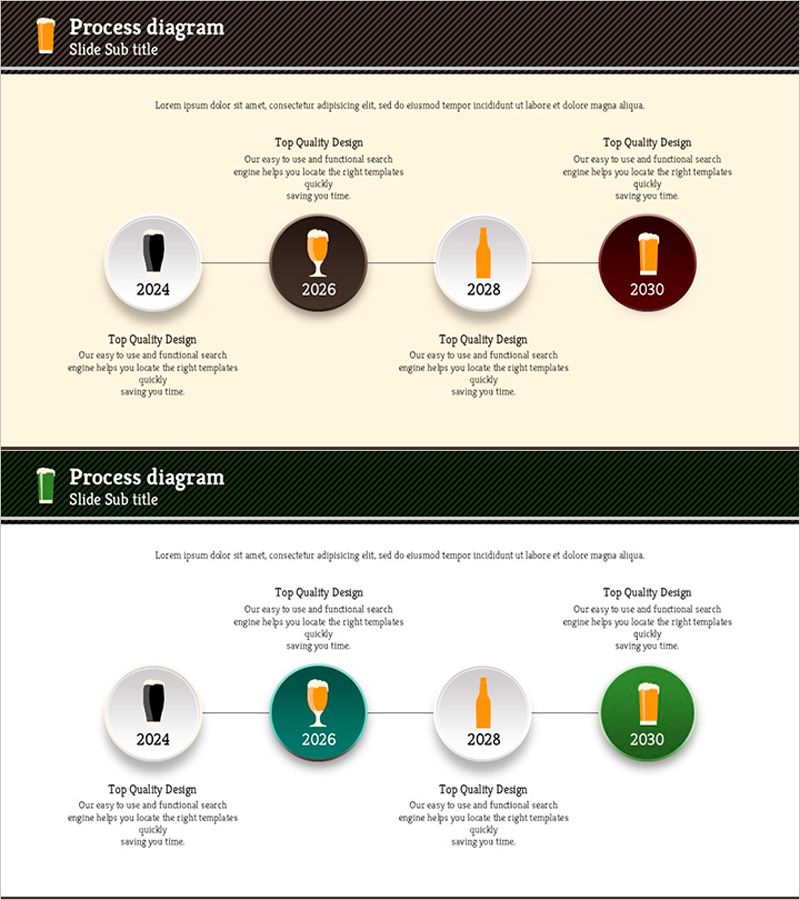
A 4-stage linear process diagram PowerPoint slide that visualizes chronological change and progression. Circular nodes connected by lines clearly represent the flow of time, with descriptive text areas positioned below each stage. Orange and burgundy accent nodes highlight critical milestones, while the light beige background enhances information clarity. This presentation slide is ready to use for business strategy timelines, product development roadmaps, organizational evolution, and historical progression narratives.
Usage Points
-
Main Usage
Designed to communicate step-by-step progression and chronological change through visual representation. Four interconnected nodes clearly show sequential advancement, with dedicated text areas below each stage for detailed information insertion.
-
How to Use
Ideal for business strategy presentations, product development roadmap explanations, organizational change narratives, and company history timelines. Easily customize node colors and text content to match your presentation requirements.
-
Recommended For
Executives, project managers, marketing professionals, and strategic planning teams presenting change processes or growth stages. Suitable for corporate presentations, investor briefings, and internal progress reports.
-
Slide Structure
2-slide set featuring identical layouts with varied color combinations. Each slide contains 4 circular nodes (approximately 80px diameter) arranged horizontally and connected by lines, with text description areas positioned below each node.
Related Products
-

The History of Buttons – Business Strategy
#Company Introduction #Business Strategy #Diagram
-

Pencil-Shaped Learning Roadmap Diagram – Introduction to Business Strategy
#Company Introduction #Business Strategy #Diagram
-

Historical History Diagram by Year – Business Strategy and Vision
#Company Introduction #Business Strategy #Diagram
-

Cluster Diagram Slide for Event Planning – Strategic Roadmap
#Company Introduction #Business Strategy #Diagram
