Horizontal Bar Chart for Beer Competitive Advantage Visualization
RJ0600043_8
- Last Update 07/02/2025
- File Size 0.2MB
- # of Slides 2
- File Format PPTX
- Slide Ratio 16:9
- Color
Keywords
- #Content-Based Slides
- #Design-Based Slides
- #Market and Competitor Analysis
- #Graph
- #Competitor Analysis
- #Competitive Advantage
- #Horizontal Bar
- #Double Horizontal Bar
- #16:9
- #horizontal bar chart PowerPoint
- #bidirectional comparison slide template
- #bar graph presentation
- #data visualization template
- #competitive analysis chart
About the Product
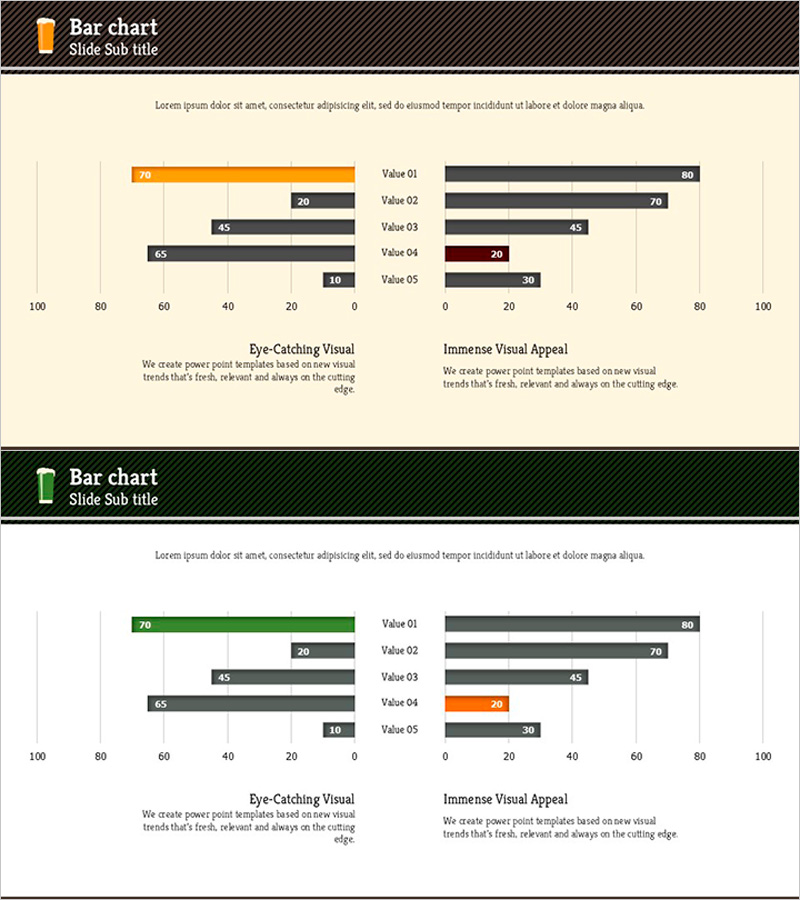
A symmetrical horizontal bar chart PowerPoint slide featuring bidirectional data comparison. The design uses contrasting orange and dark gray color schemes to visualize five data points across two sections: 'Eye-Catching Visual' (left side: 70, 20, 45, 65, 10) and 'Immense Visual Appeal' (right side: 80, 70, 45, 20, 30). This 16:9 format slide deck with 2 slides enables instant presentation of competitive advantage analysis, market strategy comparison, and performance metrics. The orange accent bar draws attention to key values while maintaining clear readability across both sections.
Usage Points
-
Main Usage
Present competitive analysis, market strategy comparison, and performance metrics using left-right symmetrical bar charts. The orange accent color highlights key data points while the dual-section layout enables clear side-by-side comparison of opposing metrics or competing products.
-
How to Use
Replace the bar values and labels with your own data. Modify the section titles on the left and right to match your comparison categories, then update each numerical value. The template supports quick color adjustments and is ready for immediate presentation use without additional design work.
-
Recommended For
Marketing professionals presenting competitive analysis, sales teams comparing product features, executives reviewing performance reports, management consultants proposing strategies, and planning teams analyzing market data.
-
Slide Structure
2-slide template with symmetrical left-right layout. Each slide displays 5 horizontal bars per section. Left section features one orange accent bar and four dark gray bars; right section mirrors the design with dark gray and orange accent bars, creating balanced bidirectional data visualization.
Related Products
-

Eco-Friendly Business Goal Market Strategy Horizontal Bar Chart
#Market and Competitor Analysis #Graph #Competitor Analysis
-

Horizontal Bar Graph for Cooking Competition
#Market and Competitor Analysis #Graph #Competitor Analysis
-

Technology Services Competitor Analysis and Advantage – Horizontal Bar Chart Slide
#Market and Competitor Analysis #Graph #Competitor Analysis
-

Bar Graph Comparing Exercise Performance by Group
#Market and Competitor Analysis #Graph #Competitor Analysis
