Analysis of Liquor Distribution Market – Infographic Slide
RJ0600043_19
- Last Update 07/02/2025
- File Size 0.3MB
- # of Slides 2
- File Format PPTX
- Slide Ratio 16:9
- Color
Keywords
About the Product
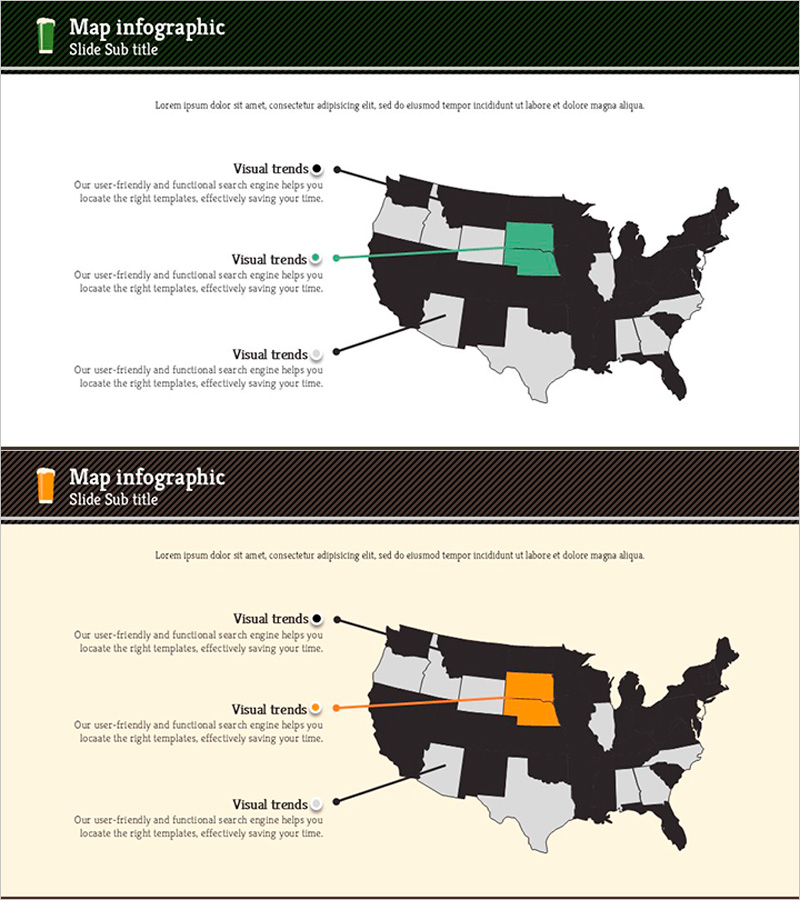
A PowerPoint slide for analyzing regional market conditions across the United States using an interactive map visualization. The design features a dark background with white, green, and orange accent colors highlighting three distinct regions, each connected to descriptive text areas via pointer lines. The two-slide set uses identical layouts with color variations, making comparative analysis straightforward. Ideal for market share presentations, competitive landscape analysis, and regional strategy discussions in business proposals and investor pitches.
Usage Points
-
Main Usage
Visualize regional market conditions, market share, and competitive landscape using a map-based infographic approach. The dark background and accent colors draw attention to key regions, while text descriptions clearly communicate regional characteristics and strategic implications for decision-makers.
-
How to Use
Enter region-specific data (region name, market size, market share, key competitors) into the text input areas corresponding to each highlighted color. Use both slides sequentially for time-based or scenario-based comparisons, or customize each slide with different regional combinations to match your analysis needs.
-
Recommended For
Marketing, sales, and strategy professionals presenting market analysis and competitive positioning; executives delivering investor pitches with regional market opportunity breakdowns; startup and SME leaders visualizing target market geographic distribution in business plans and strategic presentations.
-
Slide Structure
Each slide contains a title and subtitle area at the top, a US map with three color-highlighted regions in the center, and three text input areas on the left side for regional descriptions. Both slides share the same layout structure, allowing color scheme changes to represent different analytical scenarios or time periods.
Related Products
-

Target Country Analysis Slide - Market Access Strategy
#Market and Competitor Analysis #Marketing Plan and Strategy #Other
-

Origami Concept Global Map – Market and Competitor Analysis
#Company Introduction #Market and Competitor Analysis #Other
-

European Target Market Distribution
#Market and Competitor Analysis #Marketing Plan and Strategy #Graph
-

Target Market Analysis Slide – Strategic Market Approach
#Company Introduction #Market and Competitor Analysis #Other
