Urban Finance Business Presentation Template – Modern Business Design
J0300082
- Last Update 08/30/2025
- File Size 12MB
- # of Slides 30
- File Format PPTX
- Slide Ratio 16:9
- Color
Slide Preview


Keywords
About the Product
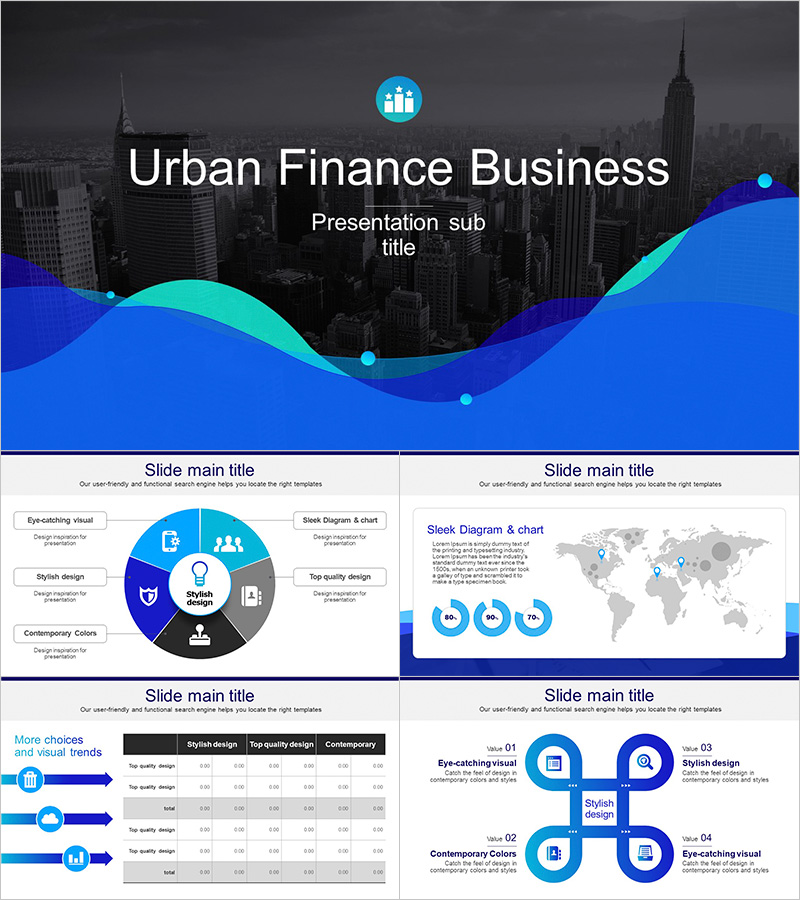
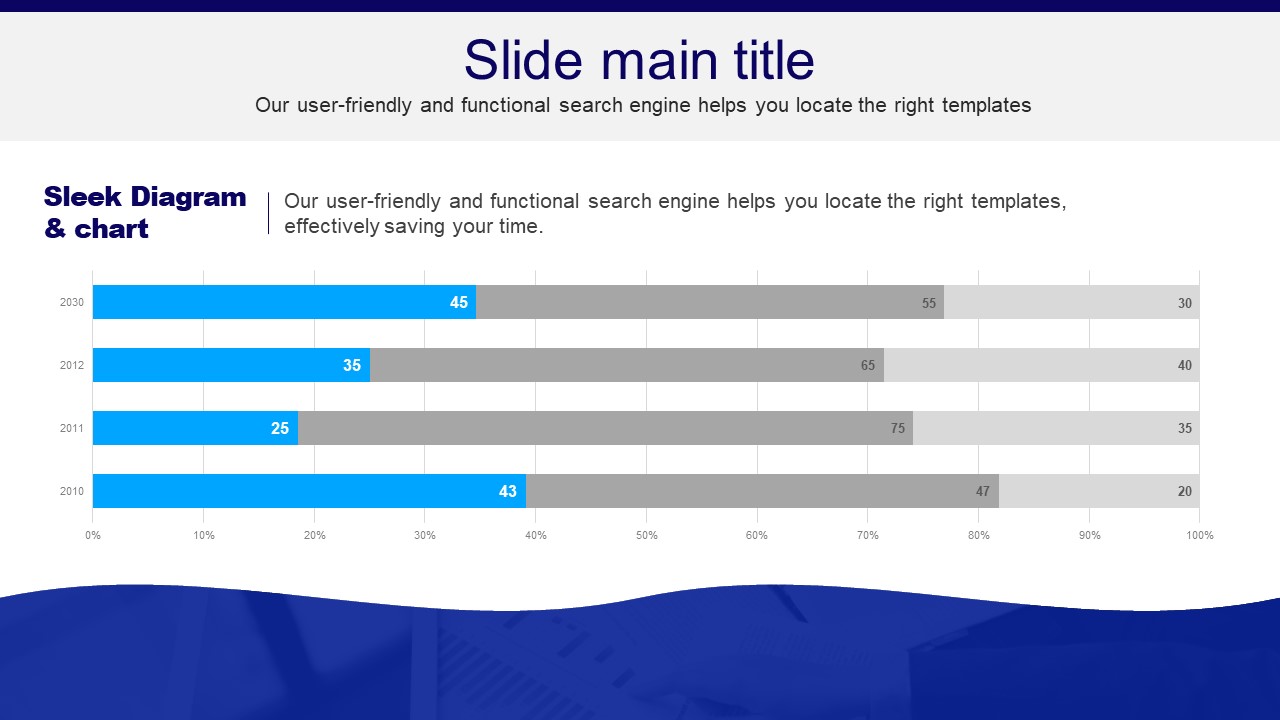
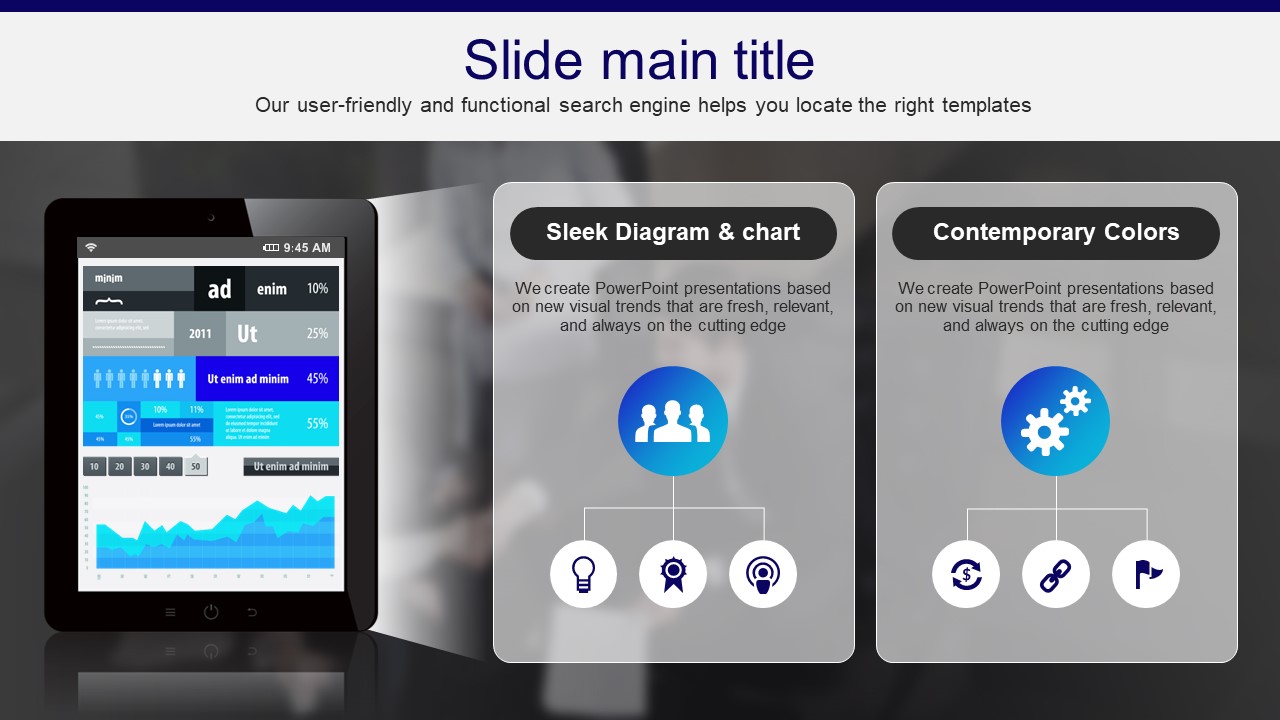
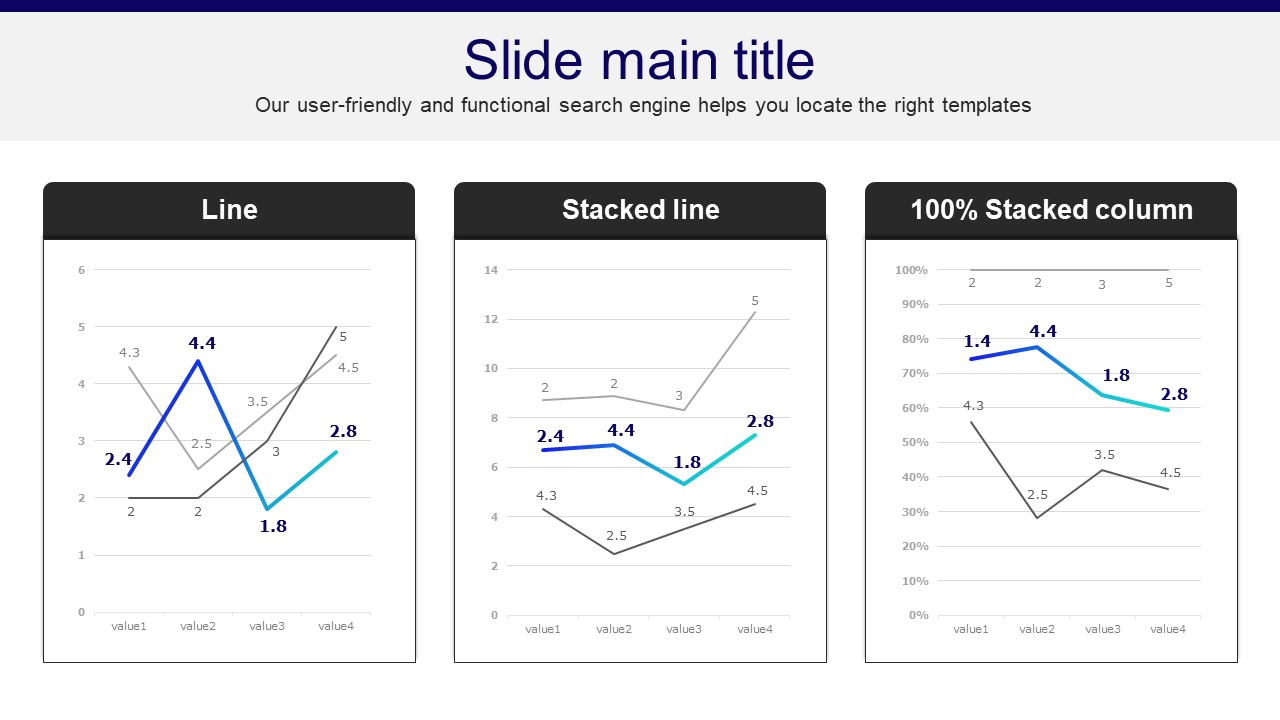
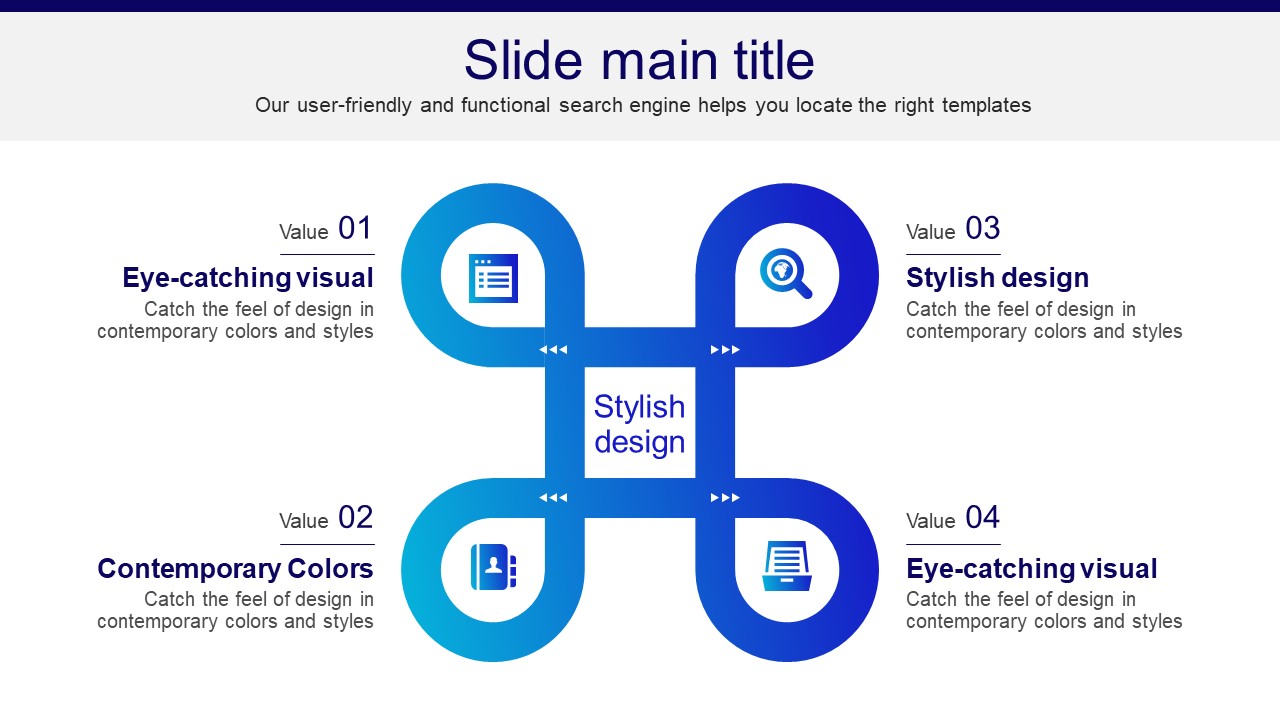
A professional PowerPoint template designed for finance and business presentations, featuring a city skyline backdrop combined with bold blue and teal wave graphics. The cover slide uses a dark charcoal background with a striking blue-teal wave overlay, while body slides shift to a clean white base with navy blue accents for maximum readability. Across 30 fully editable slides, you'll find a wide range of data visualization elements including circular diagrams, line graphs, horizontal bar charts, comparison tables, and a world map layout — making this deck ideal for financial reporting, market analysis, and investment proposals. All slides are provided in PPTX format, allowing free customization of text, colors, and numerical data. Optimized for 16:9 widescreen displays, this presentation template helps finance teams, consultants, and corporate planners deliver data-driven stories with clarity and authority.
Usage Points
-
Main Usage
Designed for data-driven business presentations including financial performance reports, market analysis, and investment pitches. The urban city backdrop and blue wave design convey professionalism and authority for corporate and finance audiences.
-
How to Use
Open the PPTX file, update the cover title and subtitle, then replace chart values and body text with your actual data. The blue and navy color scheme can be adjusted to match your brand identity using PowerPoint's theme color settings.
-
Recommended For
Best suited for finance professionals, investment analysts, corporate strategy teams, and startup founders preparing investor presentations. Also ideal for consultants delivering market research or business performance reports.
-
Slide Structure
Includes 30 slides: cover with city skyline and blue wave, 5-item circular diagram, world map with donut charts, dual-column line graph comparison, arrow diagram with comparison table, and horizontal bar chart for year-over-year data analysis.
Related Products
-

Ideas Conference Presentation Template – Stylish Business Design
#Business
-

Illustrated Folder Presentation Template – Stylish and Practical Design
#Business
-

Entertainment Company Presentation Template – Stylish and Colorful Design
#Business
-

Business Work Item Presentation Template – Professional Design
#Business
