Target Area Status Analysis Graph – Data and Insights
RJ0300082_9
- Last Update 05/12/2025
- File Size 1MB
- # of Slides 2
- File Format PPTX
- Slide Ratio 16:9
- Color
Keywords
- #Content-Based Slides
- #Design-Based Slides
- #Company Introduction
- #Market and Competitor Analysis
- #Graph
- #Other
- #Global Network
- #Target Market
- #Circles
- #Doughnut Chart
- #Map
- #16:9
- #world map PowerPoint slide
- #location pin diagram
- #global business template
- #regional analysis slide
- #geographic data visualization PPT
About the Product
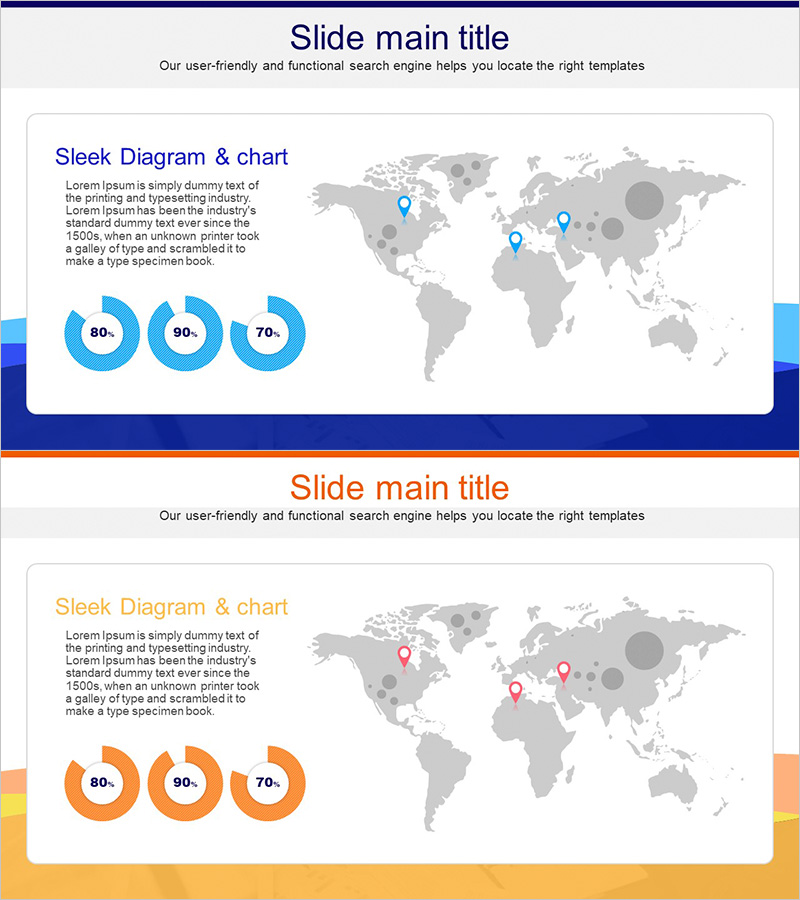
A professional world map-based PowerPoint slide designed to showcase global business distribution and regional performance metrics. The slide features a gray-toned world map background with blue and pink location pins marking target regions, complemented by three pie charts on the left (80%, 90%, 70%) displaying region-specific data. Available in 16:9 aspect ratio with 2-slide layout, fully editable for presentations, reports, and business proposals. Colors, pin positions, and data percentages can be customized to match your company branding and actual regional figures. Ideal for international expansion strategies, market analysis, and cross-border business communications.
Usage Points
-
Main Usage
Visualize global market expansion, international branch locations, regional sales distribution, and overseas customer presence on an interactive world map. Effectively communicate international strategy, market penetration, and geographic growth to executives, investors, and stakeholders in board presentations and strategic planning documents.
-
How to Use
Click on the blue and pink location pins to add or remove target regions on the map. Edit the pie chart percentages (80%, 90%, 70%) to reflect actual regional data and update legend text with region names. Customize colors to align with corporate branding guidelines. All elements are fully editable in PowerPoint.
-
Recommended For
International business managers, marketing strategy teams, executive report writers, investor relations professionals, and global expansion project leaders. Recommended for presentations requiring multi-country market analysis, regional performance comparison, and international network overview.
-
Slide Structure
Slide 1: Gray world map background with 3 location pins (blue and pink) positioned on target regions, paired with 3 pie charts (80%, 90%, 70%) arranged vertically on the left. Slide 2: Identical layout with alternative color scheme (orange-toned). Both slides include title area, descriptive text box, and editable legend elements.
Related Products
-

Global Target Region Distribution Graph – Visual Insights for Market Analysis
#Company Introduction #Market and Competitor Analysis #Graph
-

Global Food Distribution Map – Insight into the Market
#Company Introduction #Market and Competitor Analysis #Graph
-

Analysis of Key Target Countries Slide - Market and Competitor Analysis
#Company Introduction #Market and Competitor Analysis #Graph
-

Dawn City Theme Global Map
#Company Introduction #Market and Competitor Analysis #Other
