Target Profit Calculation Table – Strategy for Business Success
RJ0300082_25
- Last Update 05/12/2025
- File Size 0.1MB
- # of Slides 2
- File Format PPTX
- Slide Ratio 16:9
- Color
Keywords
- #Content-Based Slides
- #Design-Based Slides
- #Business Vision and Strategy
- #Financial Plans and Performance
- #Diagram
- #Text Box
- #Business Goals
- #Sales and Revenue
- #Table
- #Arrow
- #16:9
- #target profit calculation PowerPoint slide
- #profit calculation PPT template
- #arrow comparison layout slide
- #financial goal setting presentation
- #business strategy revenue visualization
About the Product
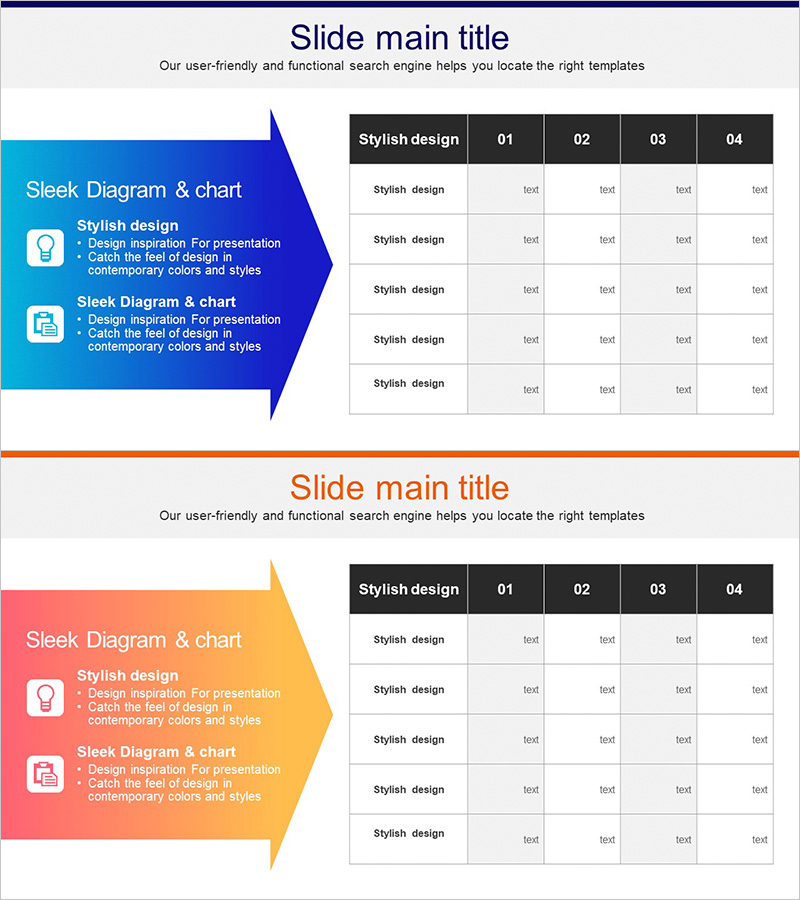
A PowerPoint slide that visualizes business goal achievement and financial strategy through profit calculation and comparison. This 2-slide set features a blue arrow on the left and an orange gradient arrow on the right, enabling side-by-side scenario comparison with editable text areas for goal setting, strategic points, and revenue metrics. Formatted in 16:9 widescreen PPTX, it integrates seamlessly into business plans, investment proposals, and financial reports to clearly communicate profit achievement pathways. The arrow-based layout makes it ideal for presentations requiring comparative analysis and decision-making support in financial strategy sections.
Usage Points
-
Main Usage
Compares two profit achievement scenarios and financial strategies to present decision-making rationale. The contrasting blue and orange arrows visually distinguish strategic directions, enabling clear communication of profit targets to investors, executives, and team members.
-
How to Use
Insert into the strategy or financial section of business plans, investment proposals, or financial reports to explain profit achievement pathways. Edit the text areas within each arrow to include target amounts, timelines, key strategies, and revenue metrics. Customize colors to match organizational branding as needed.
-
Recommended For
CFOs, financial managers, business planning teams, and investment officers presenting financial goals and execution strategies to executives, investors, and boards. Effective for startup fundraising pitches, quarterly or annual business plan presentations, and new business proposals requiring simultaneous presentation of revenue targets and implementation strategies.
-
Slide Structure
Two-slide composition with one arrow per slide. The left blue arrow represents the baseline profit scenario, while the right orange gradient arrow represents growth or alternative scenarios. Each arrow contains 4–5 editable text areas for title, target amount, achievement timeline, key strategies, and revenue metrics, enabling hierarchical presentation of detailed financial information.
Related Products
-

Business Goals Sales and Profits – Strategic Diagram Design
#Business Vision and Strategy #Financial Plans and Performance #Diagram
-

Abstract Pattern Doughnut Chart for Sales Analysis – Emphasizing Financial Performance
#Financial Plans and Performance #Diagram #Graph
-

Visualizing Business Strategies with Tables & Charts – Clear Data Presentation
#Business Strategy #Financial Plans and Performance #Diagram
-

Affiliate Business Income Statement – Visualizing Financial Performance
#Financial Plans and Performance #Diagram #Income Statement
