Income Statement Table – Visualization of Financial Performance
RJ0300082_18
- Last Update 05/12/2025
- File Size 0.1MB
- # of Slides 2
- File Format PPTX
- Slide Ratio 16:9
- Color
Keywords
- #Content-Based Slides
- #Design-Based Slides
- #Company Introduction
- #Financial Plans and Performance
- #Diagram
- #Income Statement
- #Table
- #Standard Table
- #16:9
- #income statement table
- #financial table PowerPoint
- #income statement slide template
- #financial data visualization
- #table PowerPoint slide
- #financial performance chart
About the Product
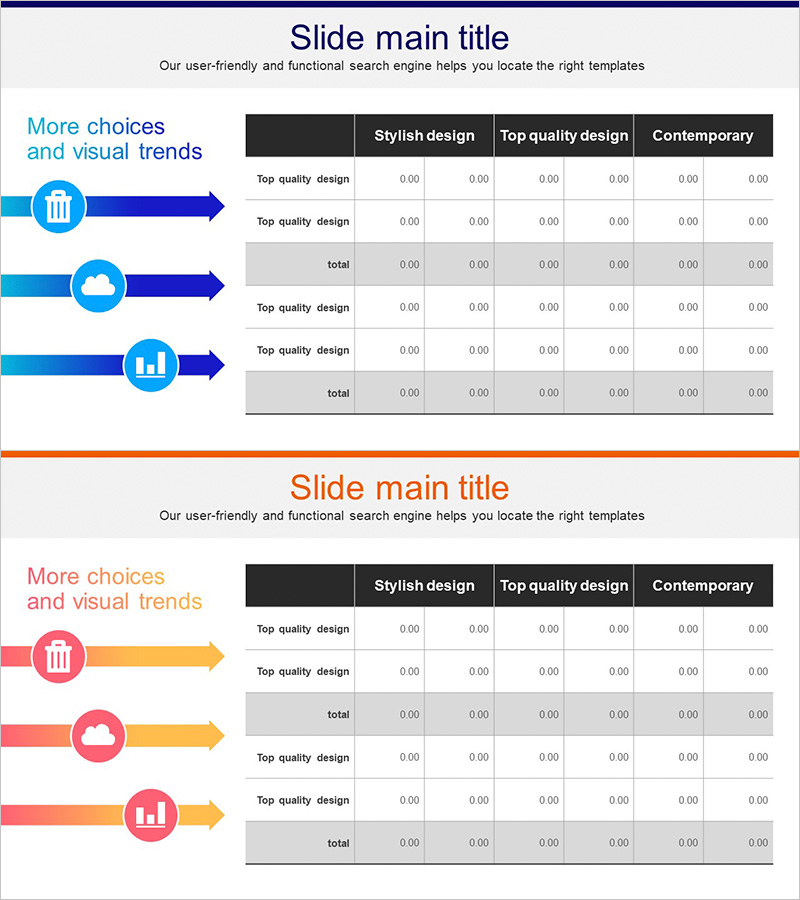
A professional income statement table PowerPoint slide designed to clearly present financial performance metrics. The horizontal table structure features six columns for organizing key financial indicators such as revenue, cost of goods sold, operating income, and net profit. The dark header row and light body cells create clear visual hierarchy, with ample data entry areas for immediate input of actual financial figures. Ideal for company presentations, business reports, investor presentations, and financial performance sections that require credible data visualization.
Usage Points
-
Main Usage
Systematically organize and compare financial performance data using a structured table format. The income statement table separates key metrics (revenue, COGS, operating income, net income) into rows and columns to support data-driven decision-making. Effectively communicates financial health and stability to investors, employees, and stakeholders with credibility.
-
How to Use
Use in company presentation financial overview sections, business report performance analysis pages, and investor relations (IR) presentations for financial metrics discussion. Input actual revenue figures, cost data, and profit margins into each cell, and apply color highlighting to emphasize key indicators. Enables period-over-period or year-over-year comparison by arranging comparative data side by side.
-
Recommended For
CFOs, financial managers, executives, and investor relations professionals presenting financial performance. Suitable for startup investment pitch decks, quarterly earnings presentations for public companies, consulting firm financial analysis reports, and any situation requiring credible financial data representation.
-
Slide Structure
Two-slide set with the first slide featuring a dark header (black) and light body (gray and white) in a six-column horizontal table format. Rows represent financial line items (revenue, COGS, operating income, etc.) with data entry cells for numerical input. The second slide provides an identical table structure for comparative analysis or detailed item categorization.
Related Products
-

Key Performance Income Analysis Table – Clear Understanding of Business Performance
#Company Introduction #Financial Plans and Performance #Diagram
-

Income Statement Table - Financial Performance Analysis
#Financial Plans and Performance #Diagram #Income Statement
-

Modern Theme Income Statement Table
#Financial Plans and Performance #Diagram #Income Statement
-

Shareholder Status Analysis with Pie Charts and Graphs
#Company Introduction #Market and Competitor Analysis #Diagram
