Visualizing Key Business Objectives – Cluster Diagram
RJ0300082_10
- Last Update 05/12/2025
- File Size 3.1MB
- # of Slides 2
- File Format PPTX
- Slide Ratio 16:9
- Color
Keywords
- #Content-Based Slides
- #Design-Based Slides
- #Business Vision and Strategy
- #Marketing Plan and Strategy
- #Diagram
- #Business Goals
- #Marketing Objectives
- #Cluster
- #Closed Cluster Diagram
- #16:9
- #cluster diagram PowerPoint
- #closed cluster diagram slide
- #business objectives visualization
- #3-item relationship diagram PowerPoint
- #marketing strategy diagram
- #PowerPoint diagram slide template
About the Product
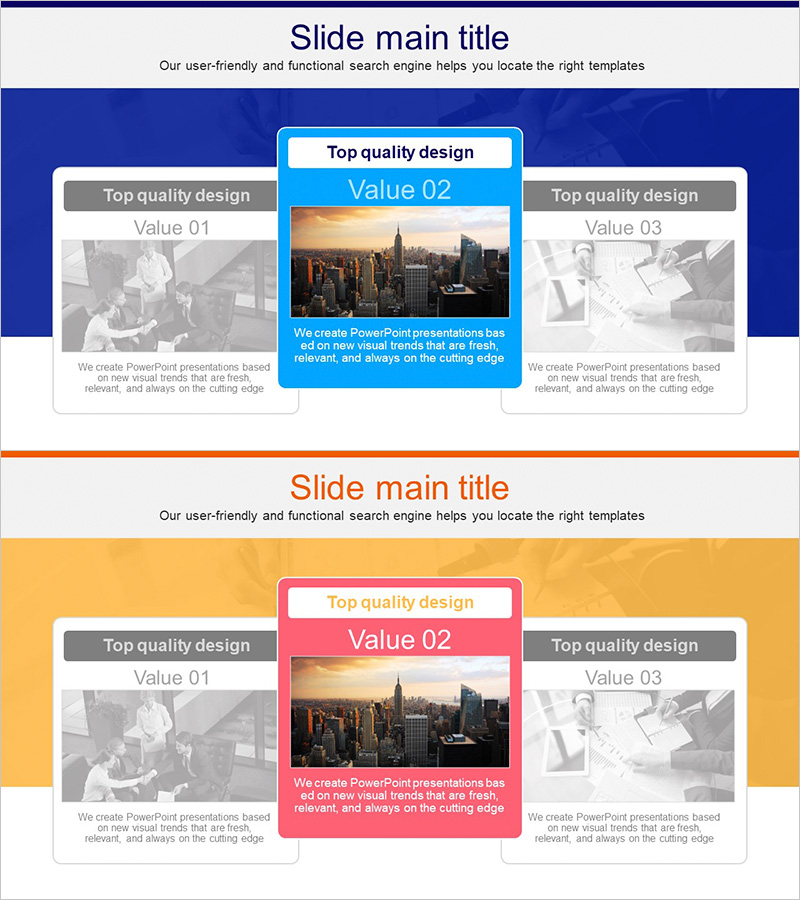
A PowerPoint slide that visualizes business objectives and strategies using a 3-item closed cluster structure. Three boxes surrounding a central concept are interconnected to emphasize relationships and integration. The dark blue background with white and light blue text boxes creates clear information hierarchy, while image areas in each section provide visual variety. This 2-slide template is ready to use for goal-setting and strategy development presentations.
Usage Points
-
Main Usage
Expresses how an organization's core objective connects with three strategies, departments, or functions. The closed structure emphasizes integration and circular influence, making it effective for explaining marketing strategies, organizational structures, and business objectives.
-
How to Use
Slide 1 presents the basic 3-item structure, while Slide 2 adds images and descriptions for each item. Freely edit text boxes and image areas, customize colors to match your brand, or input actual data to fit your presentation needs.
-
Recommended For
Ideal for executive reports, strategy presentations, marketing planning meetings, organizational restructuring explanations, and business planning sessions. Marketing teams, strategy departments, business planning offices, and sales teams use this template to clearly communicate objectives and strategies to stakeholders.
-
Slide Structure
2-slide set. Slide 1: Central concept with three closed boxes (light blue borders) positioned left, top, and right, plus text areas. Slide 2: Same structure with image areas (sample NYC cityscape photo) and descriptive text added to each box. Dark blue background, white header, light blue accent color throughout.
Related Products
-

Bulb Shape Closed Diagram – Visualizing Business Strategy and Goals
#Business Vision and Strategy #Marketing Plan and Strategy #Diagram
-

Memo Shape Diagram – Perfect for Business Vision and Marketing Strategy
#Business Vision and Strategy #Marketing Plan and Strategy #Diagram
-

Business Core Objectives Diagram – Setting Business Goals
#Business Vision and Strategy #Marketing Plan and Strategy #Diagram
-

Business Goal Step 3 Cluster Diagram – Strategy for Achieving Vision
#Business Vision and Strategy #Marketing Plan and Strategy #Diagram
