


Wave Theme Segmented Bar Graph – Competitive Market Analysis
RJ0300082_21
- Last Update 05/12/2025
- File Size 0.8MB
- # of Slides 2
- File Format PPTX
- Slide Ratio 16:9
- Color
Keywords
- #Content-Based Slides
- #Design-Based Slides
- #Market and Competitor Analysis
- #Graph
- #Competitor Analysis
- #Market Analysis
- #Horizontal Bar
- #Segmented Horizontal Bar
- #16:9
- #segmented horizontal bar chart PowerPoint
- #market competition analysis slide
- #4-series bar graph template
- #competitive analysis chart
- #how to create bar chart in PowerPoint
About the Product
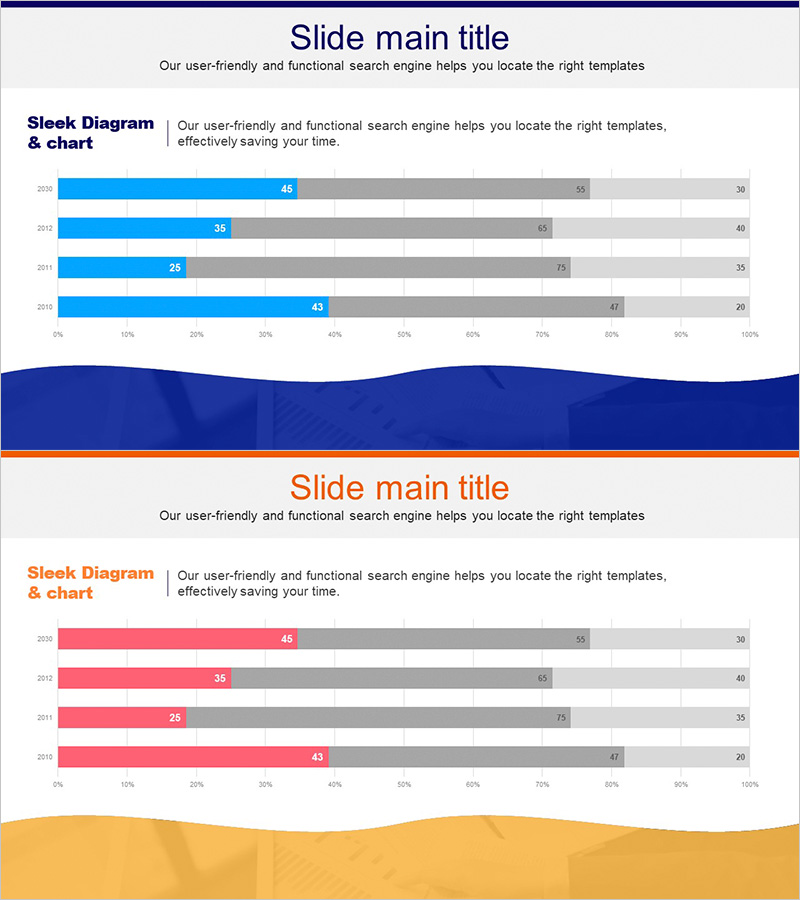
A wave-themed segmented horizontal bar chart PowerPoint slide for competitive market analysis. This presentation template visualizes market share or sales data across 4 years (2024–2021) and 3 competing companies using blue and gray data series. The slide design enables quick year-over-year and competitor-by-competitor comparison, making it ideal for business presentations including market analysis, competitive positioning, and performance reporting. Provided in 16:9 widescreen PPTX format with fully editable elements.
Usage Points
-
Main Usage
Designed to clearly visualize year-over-year and competitor-by-competitor market share or sales comparisons. The segmented structure allows simultaneous display of multiple data series, making it ideal for competitive landscape analysis, market trend reporting, and business performance reviews.
-
How to Use
Open the slide and double-click the chart to access the data table. Replace the default values with your own figures for years, competitor names, and metrics. The bar lengths adjust automatically, and colors can be customized to match your presentation theme. Insert into the market analysis section of reports, proposals, or investor presentations.
-
Recommended For
Marketing, sales, and strategy professionals presenting competitive analysis to executives and investors. Suitable for business plans, quarterly performance reports, investor pitch decks, and marketing strategy documents where objective market positioning is critical.
-
Slide Structure
2-slide set. The first slide features a blue wave background with 4 years (2024, 2023, 2022, 2021) of 3-competitor data displayed as segmented horizontal bars in blue, gray, and light gray. The second slide uses an orange wave background with identical chart structure, providing design flexibility for multi-section presentations.
Related Products
-
Efficient Diagram Slide for Business Performance Analysis
#Market and Competitor Analysis #Graph #Competitor Analysis
-
Service System Analysis Graph – Market and Competitor Analysis
#Market and Competitor Analysis #Graph #Competitor Analysis
-
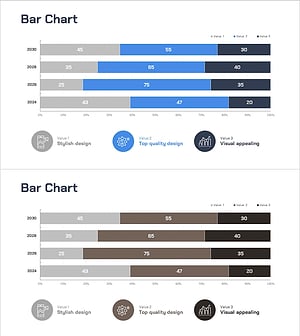
Segmented Horizontal Bar Graph Slide - Market and Competitor Analysis
#Market and Competitor Analysis #Graph #Competitor Analysis
-
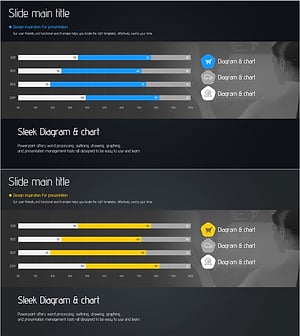
Big Data Cloud Analysis Graph – Market Competition Analysis
#Market and Competitor Analysis #Graph #Competitor Analysis