Business Gradient Diagram – Visualizing Business Areas and Fields
RJ0300082_24
- Last Update 05/12/2025
- File Size 0.1MB
- # of Slides 2
- File Format PPTX
- Slide Ratio 16:9
- Color
Keywords
- #Content-Based Slides
- #Design-Based Slides
- #Company Introduction
- #Business Introduction
- #Diagram
- #Business Areas
- #Business Areas
- #Spread
- #Centralized Diagram
- #16:9
- #4-quadrant diagram PowerPoint
- #central diagram slide template
- #business areas visualization
- #radial diagram PowerPoint
- #gradient diagram slide download
About the Product
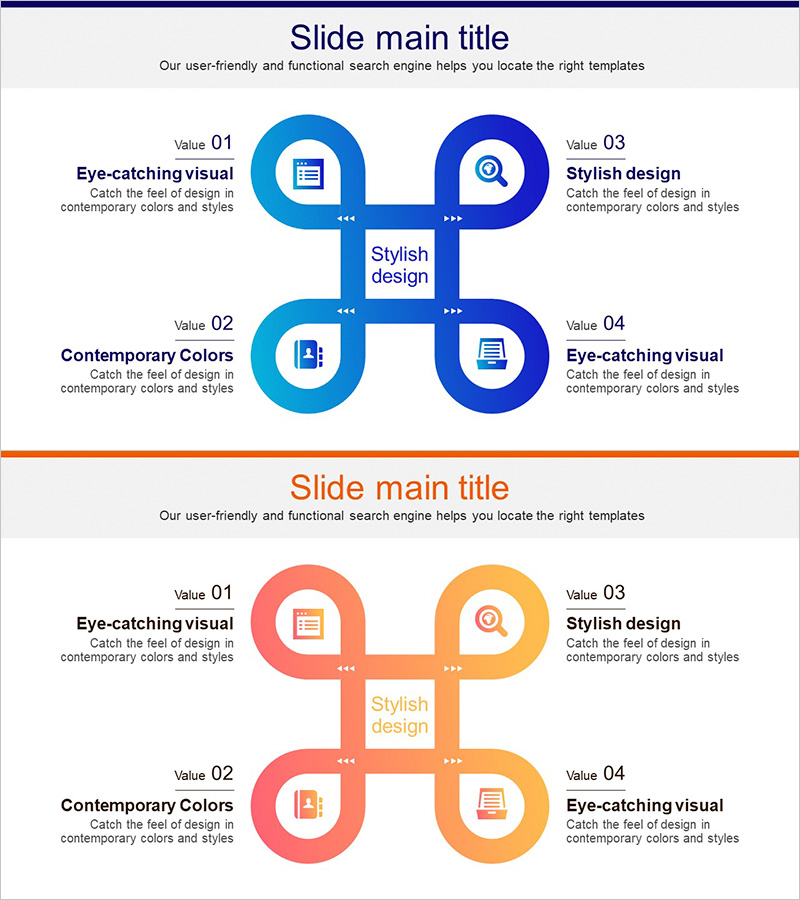
A 4-quadrant central diagram PowerPoint slide designed to visualize business areas and organizational fields. The structure radiates from a central concept to four directional nodes, each represented by circular shapes and icons. Blue and orange gradient color schemes create visual contrast and emphasis, while arrow connectors clearly show relationships to the central hub. This 2-slide set is ready to use immediately in business presentations and strategic communications.
Usage Points
-
Main Usage
Clearly express business models, organizational divisions, functional areas, and strategic positioning across four categories. The radial structure from center to periphery intuitively conveys hierarchical relationships and interconnections.
-
How to Use
Enter your core concept (e.g., business model, strategic goal) in the central text box. Add category names and descriptions to the four circular nodes. Icons and colors are fully customizable, and animations can be applied to match your presentation flow.
-
Recommended For
Ideal for business plans, company profiles, strategy presentations, organizational structure explanations, and marketing proposals. Suitable for executive briefings, investor pitches, internal training materials, and departmental overviews.
-
Slide Structure
2-slide set. Each slide features a central square text box surrounded by four circular nodes positioned at top-left, top-right, bottom-left, and bottom-right, connected by directional arrows. Slide 1 uses blue gradient tones; Slide 2 uses orange gradient tones, providing color variation options.
Related Products
-

Mobile Security Service Diagram
#Company Introduction #Business Introduction #Diagram
-

Equipment and Marketing Strategy Diagram – Visualizing Business Structure
#Company Introduction #Business Introduction #Diagram
-

Vaccine Diffusion Diagram – Business Introduction and Diffusion Strategy
#Company Introduction #Business Introduction #Diagram
-

Astronomy Earth Diagram PowerPoint – Visual Exploration
#Company Introduction #Business Introduction #Diagram
