Blue Orange 3D Donut Graph - Visual Data Analysis
RJ0300082_6
- Last Update 05/12/2025
- File Size 0.1MB
- # of Slides 2
- File Format PPTX
- Slide Ratio 16:9
- Color
Keywords
About the Product
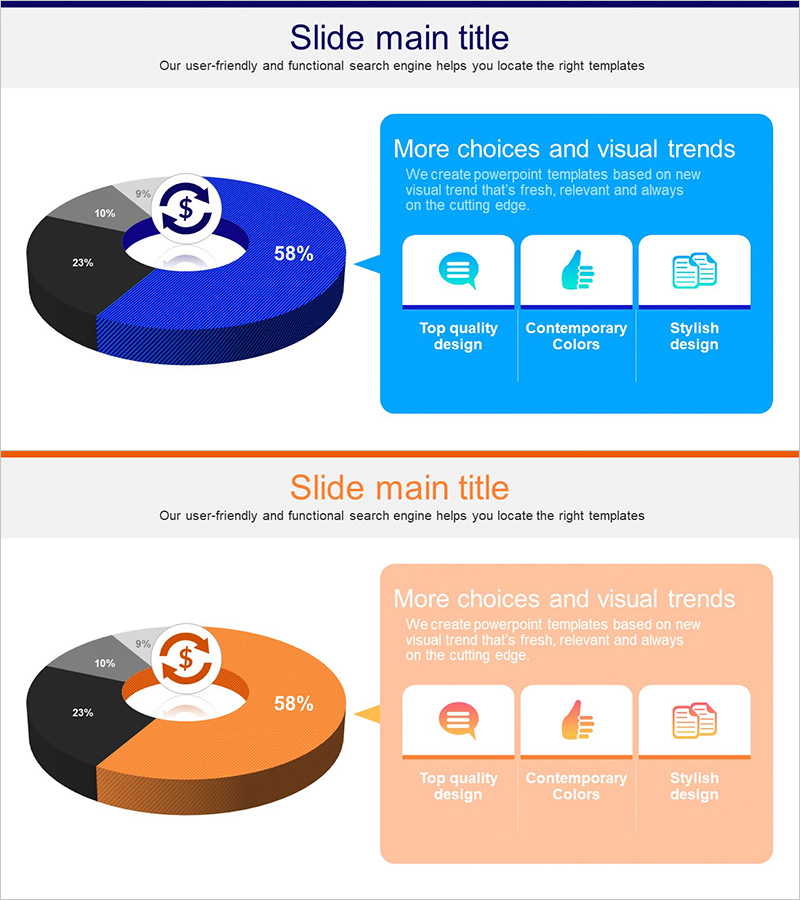
A 3D donut chart PowerPoint slide featuring blue and orange dual-tone color scheme with three distinct segments. This 2-slide set is optimized for business data analysis and market reporting presentations. Each segment is clearly defined to facilitate ratio comparison and composition analysis. The three-dimensional rendering adds visual impact to your presentation, making it ideal for reports, proposals, and business decks that require professional data visualization.
Usage Points
-
Main Usage
Effectively displays market share, revenue composition, customer distribution, and other proportional data across segments. The 3D donut structure provides greater visual prominence than standard pie charts, making it ideal for emphasizing key metrics in business reports and analytical presentations.
-
How to Use
Replace the segment values and labels with your own data. The blue and orange colors can be adjusted to match your corporate branding, and the 3D effects and shadows can be fine-tuned using PowerPoint's shape editing tools for customization.
-
Recommended For
Marketing professionals, financial analysts, executives preparing reports, and business planning teams presenting market analysis, revenue status, customer segmentation, and budget allocation. Suitable for quarterly earnings presentations, investor briefings, and internal strategy meetings.
-
Slide Structure
Two-slide layout featuring a blue-toned 3-segment donut chart on the first slide and an orange-toned version on the second. Each segment is clearly delineated with distinct boundaries, creating a three-dimensional effect through the central circular void and outer donut ring structure.
Related Products
-

Donut Chart: Nutrient Ratio by Ingredient – Simple and Intuitive Representation
#Product/Service Introduction #Graph #Features
-

Components of the Green Business Program – Sustainable Growth
#Product/Service Introduction #Diagram #Features
-

Silhouette Diagram & Circle Donut Graph – Visual Tool for Customer Analysis
#Product/Service Introduction #Market and Competitor Analysis #Graph
-

Dietary Diet Ingredients PowerPoint Slide – Capturing Health and Change
#Product/Service Introduction #Features #Composition
