Comparative Analysis of Broken Line Graphs - The Optimal Choice for Market and Competitor Analysis
RJ0300082_23
- Last Update 05/12/2025
- File Size 0.3MB
- # of Slides 2
- File Format PPTX
- Slide Ratio 16:9
- Color
Keywords
About the Product
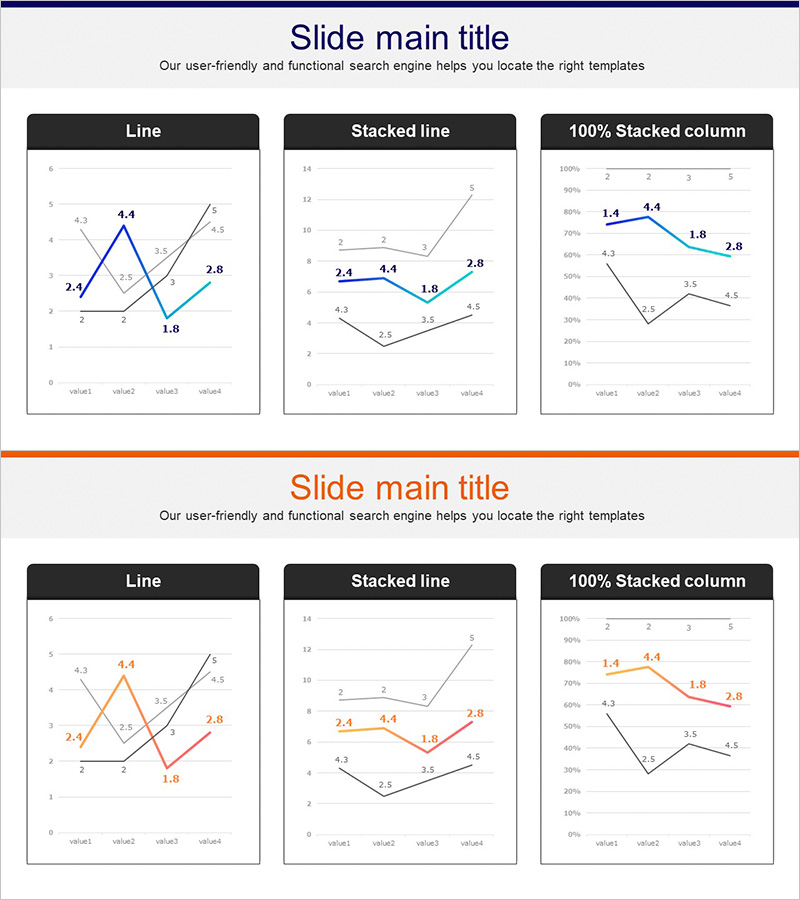
A professional PowerPoint slide deck optimized for market and competitor analysis using line graphs. This 2-slide presentation features three data visualization types: line chart, stacked line chart, and 100% stacked column chart. The navy and orange color scheme conveys analytical credibility, with each chart displaying four data points for trend comparison and performance evaluation. Clear separation between title/description areas and chart zones enables flexible editing while maintaining visual consistency across your presentation.
Usage Points
-
Main Usage
Visualize market trends and competitive performance through data-driven line graphs. The slide supports multiple analytical perspectives: line charts show trajectory changes, stacked charts reveal compositional ratios, and column charts enable absolute value comparisons. Strengthens credibility in investor pitches, executive briefings, and partner presentations.
-
How to Use
Input actual data values into each chart area and add your analysis title in the header section. Line colors and data labels can remain as-is or be customized to match your corporate brand. Applicable to market share trends, revenue growth, customer satisfaction metrics, and competitive benchmarking across industries.
-
Recommended For
Ideal for executives, marketing teams, strategy planners, and sales professionals presenting quarterly or annual performance analysis. Particularly effective for competitive benchmarking reports, market trend analysis, and business performance comparisons. Enhances data readability in investor relations materials and market analysis sections.
-
Slide Structure
Two-slide layout with the first slide containing a dual-line chart and stacked line chart, and the second slide featuring a 100% stacked column chart. Each chart includes four data points (value1–value4) with numerical labels. Independent title and subtitle areas allow customization without affecting chart integrity.
Related Products
-

Business Program Analysis Area Graph – Competitive Edge
#Market and Competitor Analysis #Diagram #Graph
-

Service Analysis Line Graph – Visualization of Competitive Advantage
#Market and Competitor Analysis #Diagram #Graph
-

Carbon Neutral Competitive Advantage Horizontal Chart
#Market and Competitor Analysis #Graph #Competitor Analysis
-

Doughnut Chart Presentation for Pet Store Competitor Analysis
#Market and Competitor Analysis #Graph #Competitor Analysis
