Target Market Development Status Graph – Market Analysis and Strategy
RJ0300082_26
- Last Update 05/12/2025
- File Size 0.2MB
- # of Slides 2
- File Format PPTX
- Slide Ratio 16:9
- Color
Keywords
- #Content-Based Slides
- #Design-Based Slides
- #Market and Competitor Analysis
- #Marketing Plan and Strategy
- #Graph
- #Other
- #Target Market
- #Target Market Strategy
- #Circles
- #Doughnut Chart
- #16:9
- #donut chart PowerPoint
- #pie chart slide template
- #market analysis graph
- #percentage visualization
- #2-stage data chart PowerPoint
About the Product
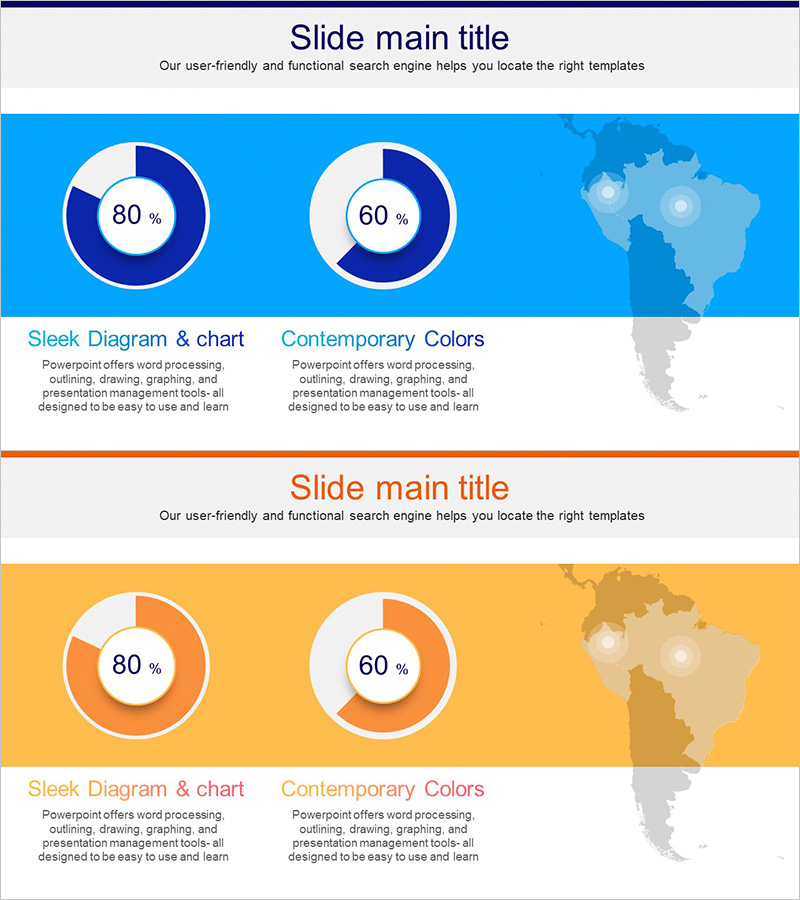
A PowerPoint slide that visualizes target market development status using donut-shaped pie charts. Two circular graphs displaying 80% and 60% enable side-by-side comparison of market share, growth rates, and achievement metrics. Two slides with bright blue and orange backgrounds allow flexible color selection to match your presentation style. A regional map icon reinforces geographic market analysis context, while text areas provide space to explain each metric clearly. Delivered in fully editable PPTX format for immediate customization.
Usage Points
-
Main Usage
Simultaneously compare two key market metrics—such as market share, growth rate, or achievement percentage—using donut-shaped charts. Clearly communicate market status through both numerical and visual representation, strengthened by geographic analysis context.
-
How to Use
Slide 1 features a blue background; Slide 2 has an orange background. Select the slide that matches your presentation tone. Edit the donut chart percentages with your actual data and populate the text areas with market analysis details to complete the slide.
-
Recommended For
Ideal for business plans, investor pitch decks, market analysis reports, and marketing strategy presentations. Suitable for executive briefings, marketing team meetings, and sales team strategy sessions requiring market status visualization.
-
Slide Structure
Two-slide layout. Each slide contains a title area at the top, two donut-shaped pie charts in the center (displaying 80% and 60%), a regional map icon on the right, and descriptive text area at the bottom. Optimized for 16:9 widescreen format in modern presentation environments.
Related Products
-

South America Target Region Achievement Rate – Market and Strategy Analysis
#Market and Competitor Analysis #Marketing Plan and Strategy #Graph
-

Area Graph for Competitor Analysis
#Market and Competitor Analysis #Marketing Plan and Strategy #Graph
-

Infographic Slide for Regional Data Visualization
#Market and Competitor Analysis #Marketing Plan and Strategy #Graph
-

Analysis of European Target Regions – Insights for Marketing Strategy Development
#Market and Competitor Analysis #Marketing Plan and Strategy #Graph
