Target Market Status Analysis Graph
RJ0300082_19
- Last Update 05/12/2025
- File Size 0.2MB
- # of Slides 2
- File Format PPTX
- Slide Ratio 16:9
- Color
Keywords
- #Content-Based Slides
- #Design-Based Slides
- #Market and Competitor Analysis
- #Marketing Plan and Strategy
- #Graph
- #Other
- #Target Market
- #Target Market Strategy
- #16:9
- #target market analysis PowerPoint
- #market status comparison slide
- #regional market data chart
- #marketing strategy presentation
- #how to create market analysis in PowerPoint
About the Product
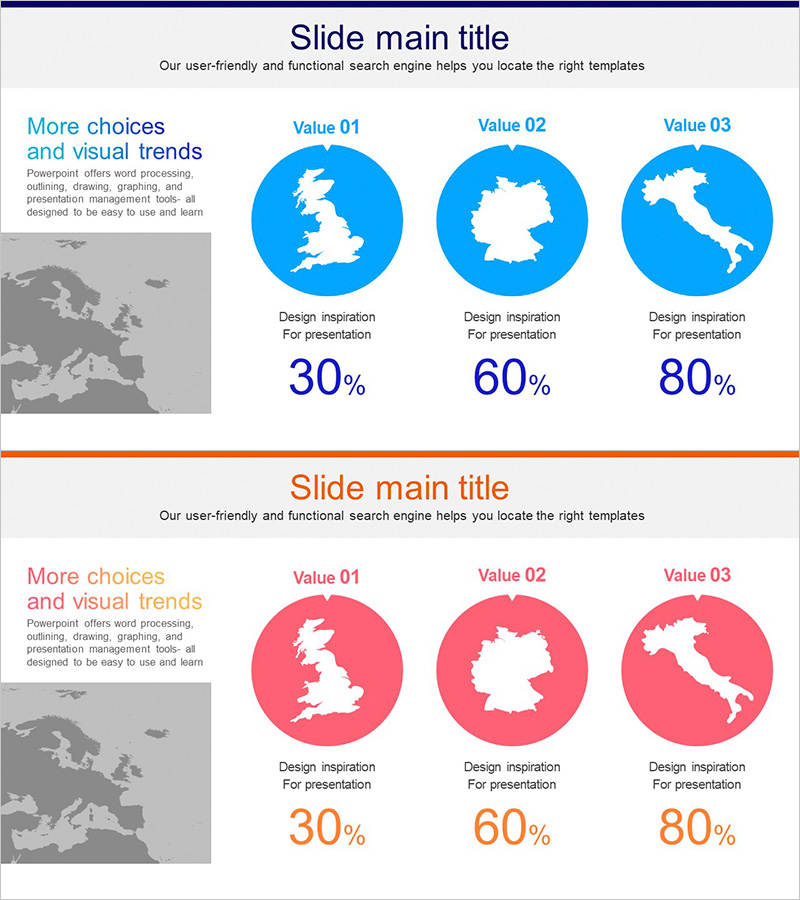
A PowerPoint slide designed to compare and analyze target market status by region. The left side features a text area for market analysis content, while the right side displays three circular charts visualizing regional data (UK, Germany, Italy) with percentage metrics. Available in two color versions—blue and red—allowing you to match your corporate brand identity. This 16:9 widescreen 2-slide set is ready to use for marketing strategy development, competitive analysis, and market share comparison presentations.
Usage Points
-
Main Usage
This slide supports market analysis during strategic planning by presenting target market status across regions at a glance. It transforms market data into percentage-based visuals, enabling executives and team members to clearly understand market opportunities and competitive risks.
-
How to Use
Enter market analysis details (market size, growth rate, competitive intensity) in the left text box and replace the chart values with your actual data. Select either the blue or red color version to match your corporate identity, then insert into your presentation.
-
Recommended For
Ideal for marketing managers, business planning teams, and executives preparing reports. Perfect for new market entry plans, market expansion strategies, and investor pitch decks—especially in the target market analysis section.
-
Slide Structure
Two-slide format with each slide divided into a left text area (title and description input space) and right data visualization area (three circular charts with percentage metrics). Offered in blue and red color themes for flexible brand alignment.
Related Products
-

Precise Analysis of European Target Areas – Market and Strategy
#Market and Competitor Analysis #Marketing Plan and Strategy #Graph
-

European Market Share Analysis Graph
#Market and Competitor Analysis #Marketing Plan and Strategy #Graph
-

US Target Market Analysis Graph – Understanding Market Segmentation
#Market and Competitor Analysis #Marketing Plan and Strategy #Graph
-

Visualizing Country Design Preferences with Rectangle Diagrams
#Market and Competitor Analysis #Marketing Plan and Strategy #Graph
