Blue Orange Market Analysis Donut Chart – Essence of Data Visualization
RJ0300082_5
- Last Update 05/12/2025
- File Size 0.3MB
- # of Slides 2
- File Format PPTX
- Slide Ratio 16:9
- Color
Keywords
- #Content-Based Slides
- #Design-Based Slides
- #Market and Competitor Analysis
- #Graph
- #Competitor Analysis
- #Market Analysis
- #Circles
- #Doughnut Chart
- #16:9
- #donut chart PowerPoint
- #pie chart slide template
- #data visualization PPT
- #market analysis graph
- #ratio chart slide
- #circular graph template
- #segment data PowerPoint
About the Product
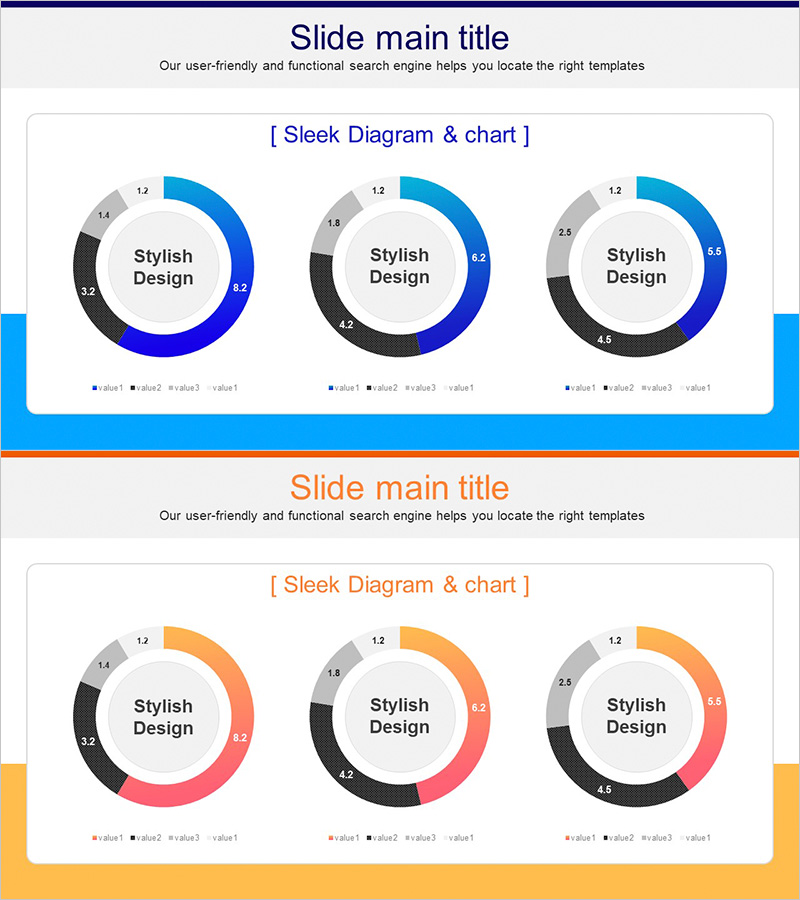
A professional donut chart PowerPoint slide designed for market analysis, industry segmentation, and competitive analysis. This presentation template features three donut graphs with a blue and orange dual-tone color scheme, each displaying four data segments. The center circular area accommodates title text, allowing you to clearly communicate the slide's purpose. With a 16:9 widescreen format and 2-slide composition, this template is ready for immediate use in business reports, proposals, and strategic presentations. All numerical values and legends are fully editable to match your data requirements.
Usage Points
-
Main Usage
Visualize proportional data such as market share, customer demographics, revenue distribution, and industry breakdown in a clear, comparative format. The three donut charts arranged side-by-side enable effective comparison across time periods, regions, or categories, while the center text area emphasizes key insights and data significance.
-
How to Use
Integrate this template into business plans, marketing strategies, quarterly performance reports, and investor pitch decks within the market analysis or competitive analysis sections. Double-click on each donut graph to edit numerical values and legends. Adjust colors to align with your corporate branding. Modify the title text box to specify your analysis topic.
-
Recommended For
Marketing teams presenting market research, executive management reports, business development teams analyzing competitors, finance teams breaking down revenue composition, and consulting firms preparing industry analysis. Ideal for executives, strategists, data analysts, and consultants who require data-driven presentation materials.
-
Slide Structure
Two-slide composition with three donut charts arranged horizontally on each slide. Each donut is segmented into four data categories with a center circular area for title text. Legends are positioned below each chart using blue, orange, and gray color gradients to distinguish data series.
Related Products
-

Survey and Poll Analysis Graphs – Optimized for Market Analysis
#Market and Competitor Analysis #Diagram #Graph
-

Medical Comparative Analysis Donut Circle Graph – Effective Market Analysis
#Market and Competitor Analysis #Graph #Competitor Analysis
-

Competitor Revenue Analysis Chart – Visualize Market Dynamics
#Market and Competitor Analysis #Diagram #Graph
-

Business Market Analysis Donut Circle Chart – Visualizing Competitive Advantage
#Market and Competitor Analysis #Graph #Competitor Analysis
