Tablet PC Mockup Vertical Bar Graph – Market Analysis and Tech Insights
RJ0300082_20
- Last Update 05/12/2025
- File Size 0.1MB
- # of Slides 2
- File Format PPTX
- Slide Ratio 16:9
- Color
Keywords
- #Content-Based Slides
- #Design-Based Slides
- #Business Introduction
- #Market and Competitor Analysis
- #Graph
- #Other
- #Technological Status
- #Market Analysis
- #Column
- #Segmented Column
- #16:9
- #vertical bar chart PowerPoint
- #market analysis slide template
- #tablet mockup presentation
- #data comparison chart
- #technology trend visualization
About the Product
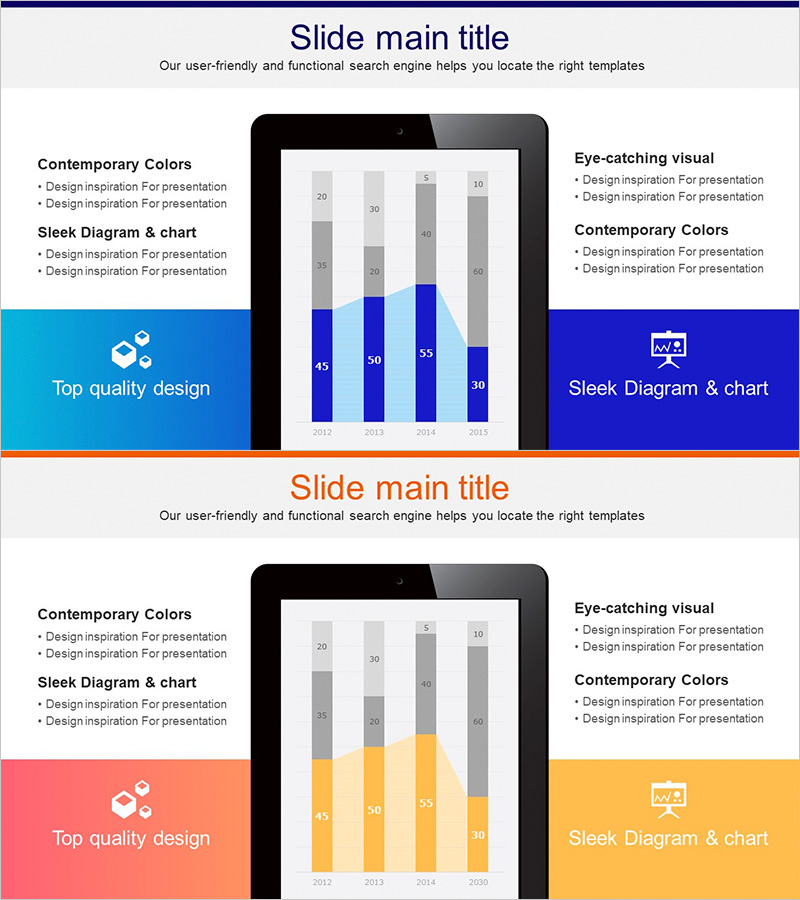
A PowerPoint slide featuring a tablet PC device mockup with a 4-series vertical bar chart displaying market data from 2012 to 2015. The chart uses blue, gray, and orange color coding to distinguish data categories, making it ideal for technology trend analysis, market size comparison, and competitive benchmarking. This 2-slide presentation template is ready to use for business reports, technology briefings, and market analysis presentations.
Usage Points
-
Main Usage
Visualize market data, technology trends, and competitive performance metrics displayed on a tablet device screen. The 4-series vertical bar chart arranged by year clearly shows changes and comparisons across multiple data categories over time.
-
How to Use
Use in business reports, technology presentations, and market analysis decks to communicate quantitative data persuasively. The tablet mockup is especially effective for mobile and web technology presentations where device compatibility and user experience need emphasis.
-
Recommended For
Marketing professionals, technology strategists, executives, investment pitch presentations, and academic seminars. Ideal for presenting multi-series numerical data such as market research findings, technology performance comparisons, revenue trends, and customer satisfaction metrics.
-
Slide Structure
2-slide set. First slide features blue accent background with tablet mockup and 4-series vertical bar chart (2012–2015 data). Second slide uses orange accent background with identical chart structure. Each slide has text area on left, tablet mockup in center, and title area on right.
Related Products
-

Social Network Market Analysis Bar Chart – Trends Insight
#Product/Service Introduction #Market and Competitor Analysis #Graph
-

Battery Shape Vertical Bar Graph – Market Status Analysis
#Business Introduction #Market and Competitor Analysis #Graph
-

Business Market Analysis Segmented Vertical Bar Graph
#Business Introduction #Market and Competitor Analysis #Graph
-

Visualizing the Changing Trend of the Ageing Population with a 100% Stacked Bar Graph
#Business Strategy #Market and Competitor Analysis #Marketing Plan and Strategy
