Vertical Bar Graph for Market and Competitor Analysis – Professional Data Visuals
RJ0300082_15
- Last Update 05/12/2025
- File Size 0.3MB
- # of Slides 2
- File Format PPTX
- Slide Ratio 16:9
- Color
Keywords
About the Product
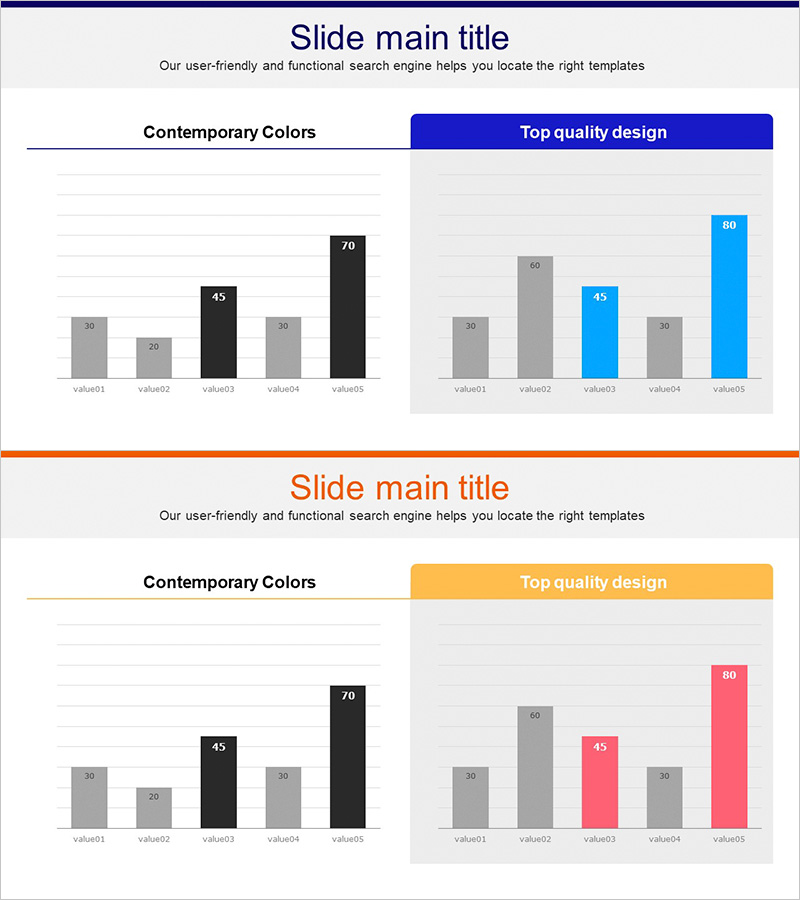
A vertical bar chart PowerPoint slide optimized for market and competitor analysis presentations. This slide deck features five data items displayed with contrasting colors—gray, black, blue, and pink—to highlight each category distinctly. The 2-slide set presents the same data structure in two color themes: blue accent and pink accent versions, allowing you to select the theme that best matches your presentation tone. Numerical labels appear above each bar for precise data communication, and the 16:9 widescreen format ensures compatibility with modern projectors and displays. Delivered in editable PPTX format for quick customization with your own data.
Usage Points
-
Main Usage
Compare five data points such as market size, competitor revenue, market share, or growth rates at a glance. Bar height and color differentiation convey relative magnitude and priority intuitively, providing strong visual support for your presentation narrative.
-
How to Use
Insert this slide into executive reports, business plans, or marketing strategy presentations in the market analysis section. Double-click the numerical values to replace them with your own data, then select either the blue or pink color theme version that aligns with your presentation style.
-
Recommended For
Ideal for executives, marketing managers, business development professionals, consultants, and investor pitches. Particularly effective for competitive analysis, market overview, and performance comparison in any business presentation context.
-
Slide Structure
Two-slide set featuring the same 5-item vertical bar chart in two distinct color themes. Slide 1 emphasizes blue accents; Slide 2 emphasizes pink accents, allowing flexible selection based on presentation context. Numerical labels display above each bar, and the light gray background maximizes data readability.
Related Products
-

Concise Analysis Column Graph & Table Slide
#Market and Competitor Analysis #Diagram #Graph
-

Business Market Analysis Bar Graph – Visualizing Competitive Analysis
#Market and Competitor Analysis #Diagram #Graph
-

Competitor and Market Analysis Green Navy Slide
#Market and Competitor Analysis #Graph #Competitor Analysis
-

Competitor Analysis Comparison Graph – Visualizing Market Shares
#Market and Competitor Analysis #Graph #Competitor Analysis
