Broken Line Competitive Advantage Analysis – Market and Competitor Insights
RJ0300082_11
- Last Update 05/12/2025
- File Size 0.1MB
- # of Slides 2
- File Format PPTX
- Slide Ratio 16:9
- Color
Keywords
- #Content-Based Slides
- #Design-Based Slides
- #Market and Competitor Analysis
- #Graph
- #Competitor Analysis
- #Competitive Advantage
- #Line
- #Line Chart
- #16:9
- #line chart PowerPoint
- #competitive advantage analysis presentation
- #market analysis slide
- #dual-series trend chart
- #competitor comparison PPT
- #business data visualization
About the Product
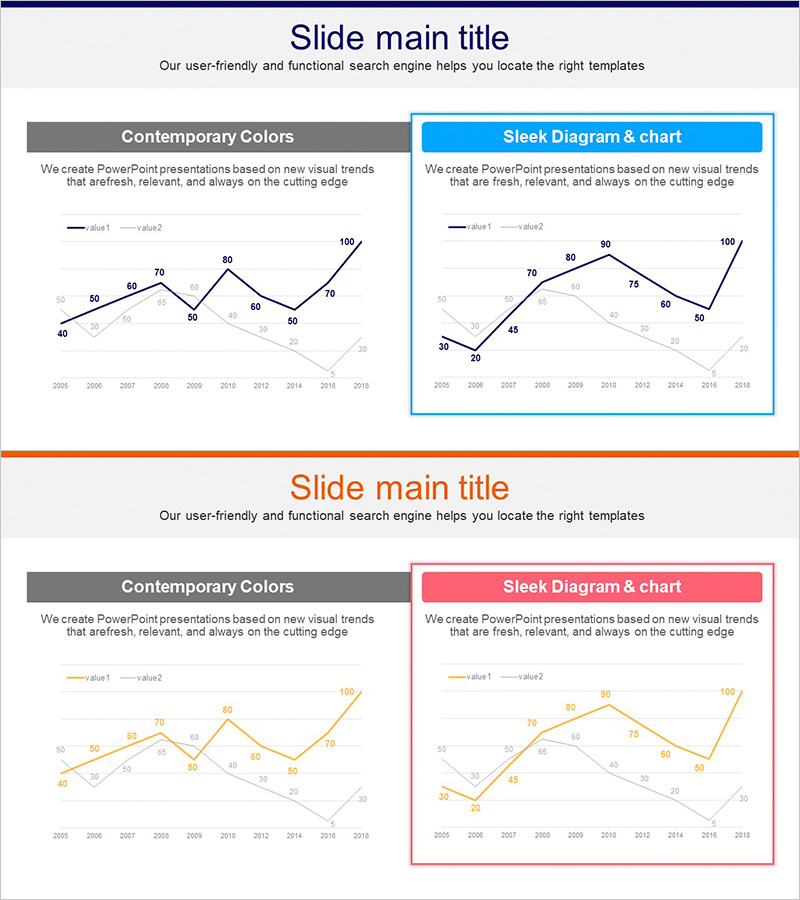
A dual-series line chart PowerPoint slide designed for competitive advantage analysis and market insights. This presentation template visualizes data trends from 2005 to 2018, with blue and orange trend lines clearly distinguishing competitor performance comparisons. The 16:9 widescreen format includes 2 slides ready for immediate use in competitive strategy presentations and market analysis reports. Data points and numerical labels are clearly marked, making it highly effective for presenting quantitative evidence and supporting strategic decisions with visual clarity.
Usage Points
-
Main Usage
Compare competitor performance trends over time and demonstrate competitive advantage shifts in the market using quantitative data. The intersection points and rising/falling segments of dual trend lines provide strategic decision-making evidence.
-
How to Use
Insert into executive reports, strategy meetings, investor presentations, and business plan market analysis sections. Edit with actual data to customize colors and values for immediate presentation use.
-
Recommended For
Executives, strategy planners, marketing professionals, consultants, and investment analysts requiring data-driven decision-making. Particularly valuable for competitive analysis, market research, and performance evaluation presentations.
-
Slide Structure
2-slide set featuring dual-series line charts on each slide. X-axis displays years 2005–2018, Y-axis ranges 0–100. Blue and orange trend lines represent different datasets. Numerical labels at each data point enable precise value verification and clear trend comparison.
Related Products
-

Market Competitiveness Comparison Graph – Highlighting Competitive Advantage
#Market and Competitor Analysis #Graph #Competitor Analysis
-

Korea China Japan Analysis Graph – Market Competitive Advantage
#Market and Competitor Analysis #Graph #Other
-

Competitor Comparison Analysis Graph - Highlighting Competitive Advantage
#Market and Competitor Analysis #Graph #Competitor Analysis
-

Neon Tone Competitor Analysis Broken Line Graph
#Market and Competitor Analysis #Graph #Competitor Analysis
