
Finance Presentation Template – Sleek and Modern Design
J0300061
- Last Update 01/07/2025
- File Size 13.8MB
- # of Slides 31
- File Format PPTX
- Slide Ratio 16:9
- Color
Slide Preview


Keywords
About the Product
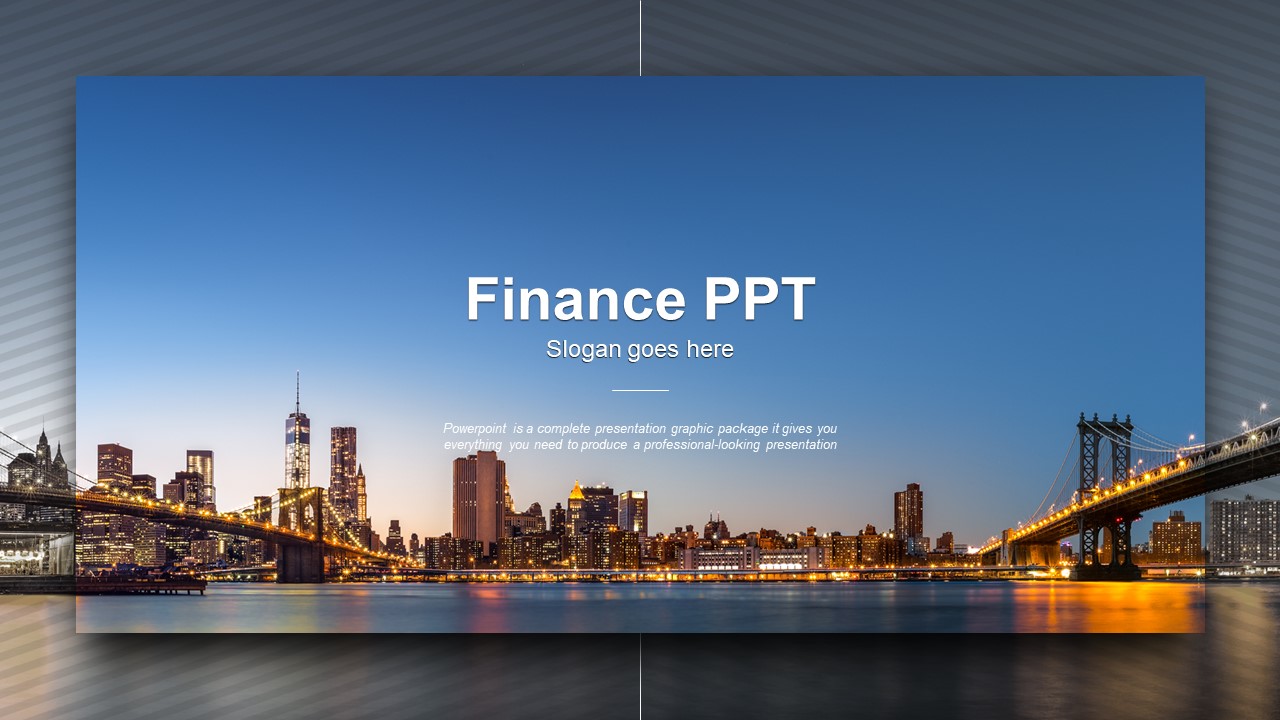
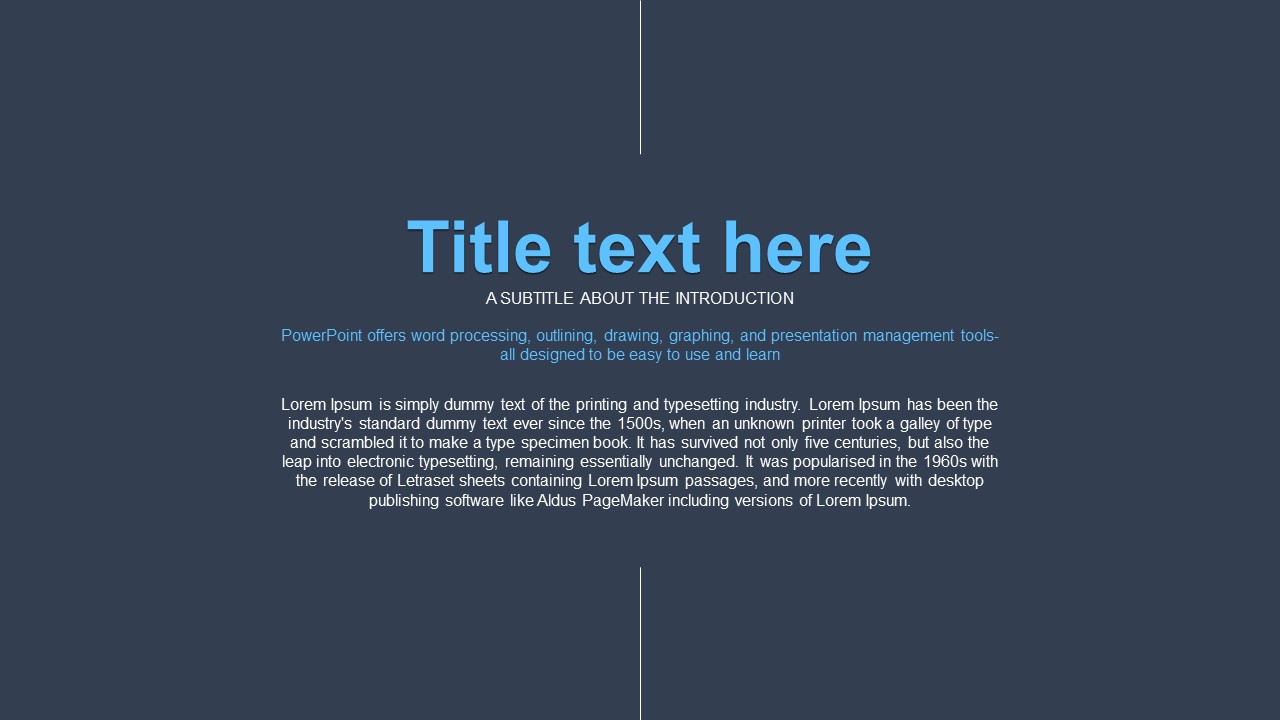
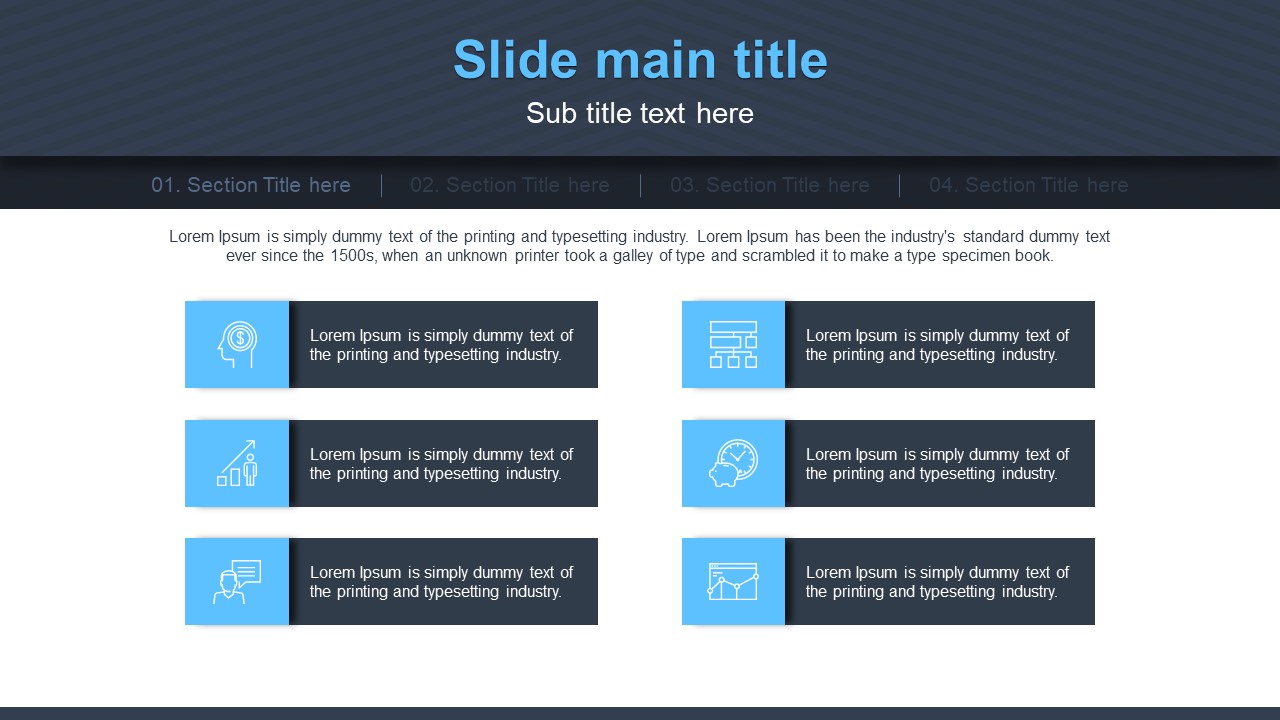
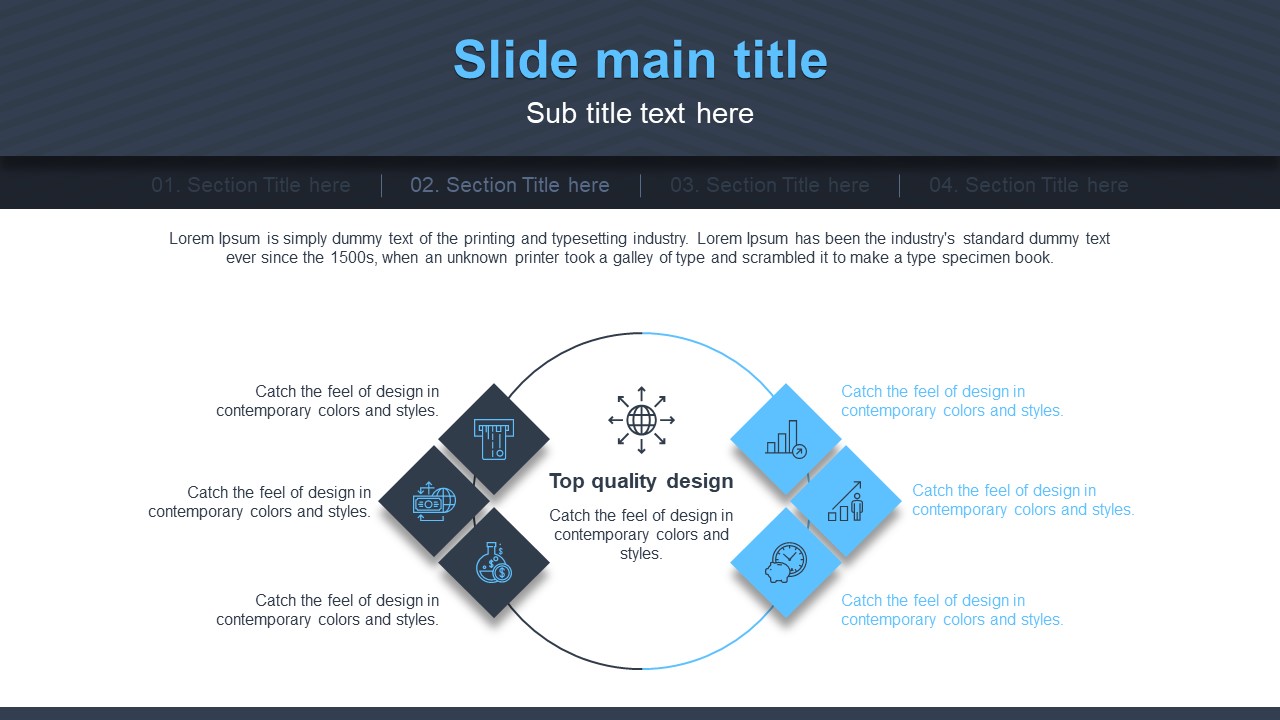
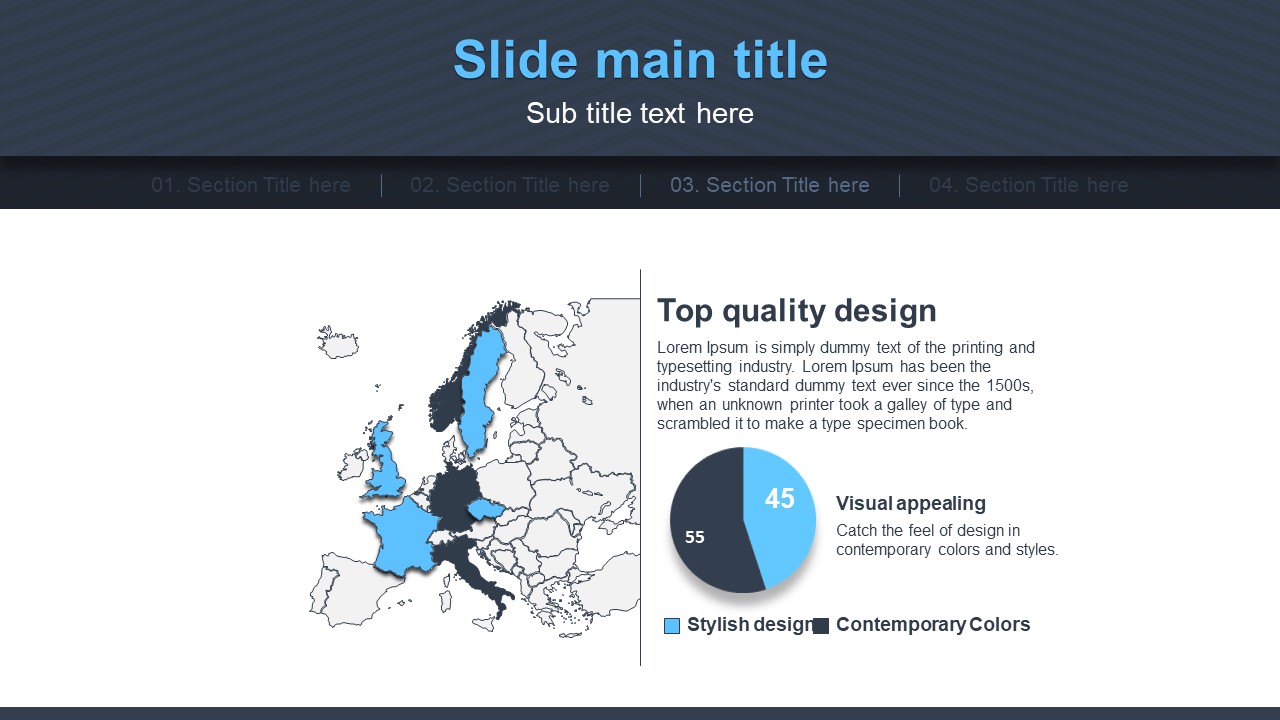
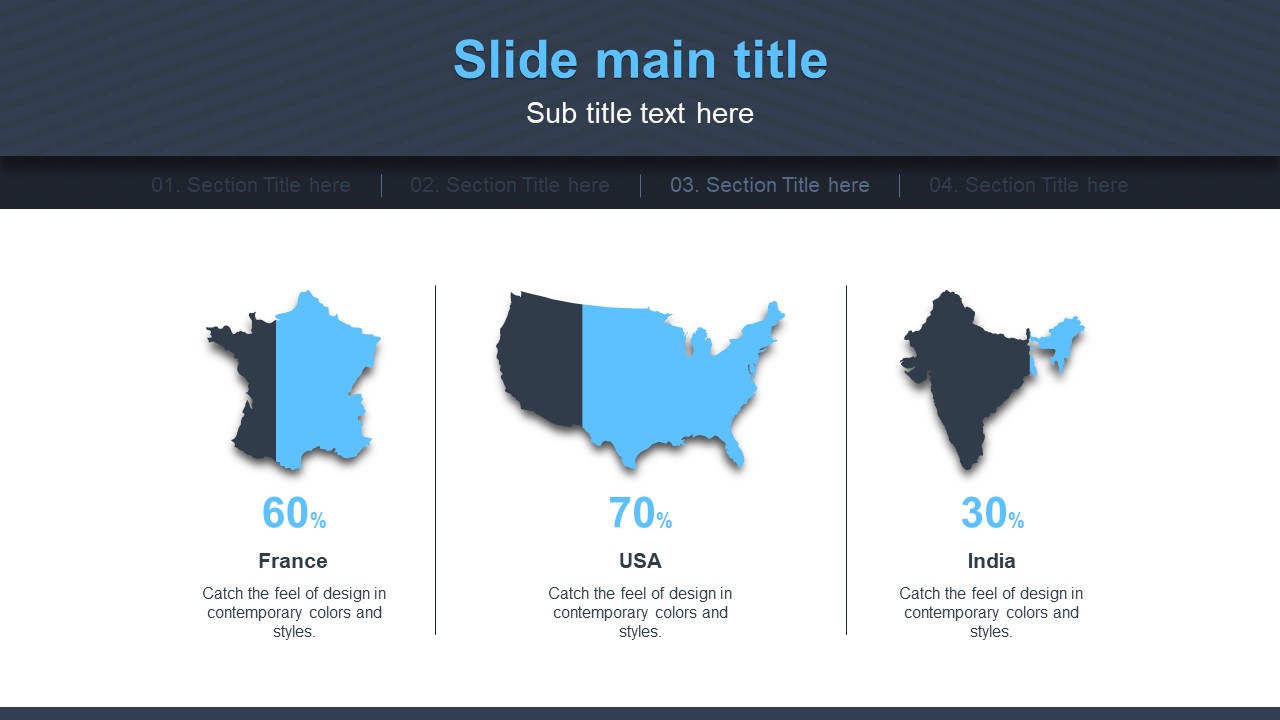
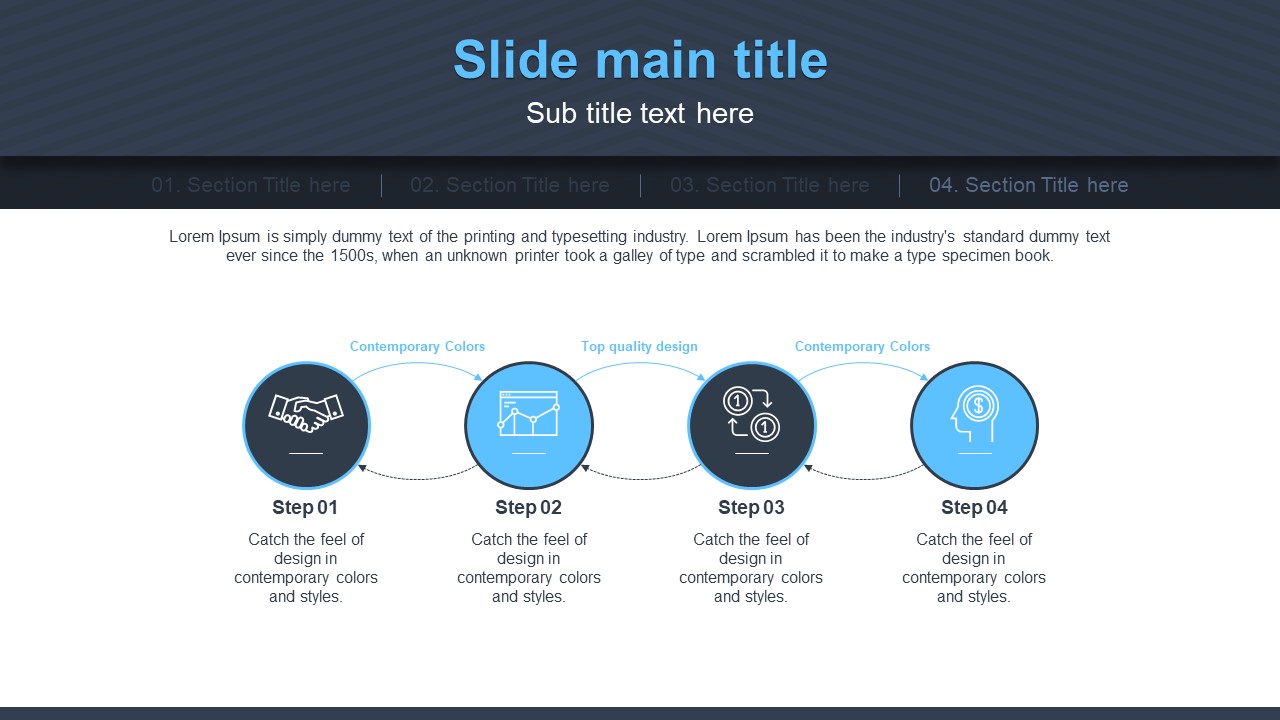
This professional finance PowerPoint template features a full-bleed Manhattan city skyline cover slide paired with a dark charcoal header and sky blue accent color scheme throughout all 31 slides. The deck includes a wide range of data visualization layouts — horizontal bar charts for year-over-year comparisons, a world map infographic with pictogram data, a radar chart, a four-direction diamond icon diagram, pie and donut charts, and section navigation tabs — giving you everything needed for a polished financial presentation. Ideal for investor reports, earnings presentations, asset management briefings, and corporate finance pitches, this presentation template is fully editable in PPTX format. Replace placeholder text, update chart figures, and swap colors to match your brand in minutes. Consistent slide design across all 31 slides ensures a cohesive, credible look for any financial audience.
Usage Points
-
Main Usage
Designed for financial reporting, investor presentations, and asset management briefings, this template provides a complete set of data-driven slides that communicate financial information clearly and professionally to any audience.
-
How to Use
Download the PPTX file and open it in PowerPoint or a compatible application. Replace the placeholder text and chart data with your actual figures, and adjust the dark charcoal and sky blue color scheme to match your corporate brand colors using the theme editor.
-
Recommended For
Finance professionals, investment analysts, startup founders preparing investor pitches, and corporate finance or strategy teams who need to present data-heavy financial reports in a visually consistent and credible format.
-
Slide Structure
The 31-slide deck includes a full-bleed city skyline cover, four-tab section navigation slides, a four-direction diamond icon diagram, horizontal bar charts for multi-year comparisons, a world map with pictogram infographic, a radar chart, pie and donut charts, and gear icon feature slides.
Related Products
-

Multitasking Presentation Template – Optimized Design for Business
#Business
-

Entertainment Company Presentation Template – Stylish and Colorful Design
#Business
-

Partnership PowerPoint Template – Ideal for Business Presentations
#Business
-

Illustrated Folder Presentation Template – Stylish and Practical Design
#Business
