7 Week Schedule – Supporting Efficient Operations Planning
RJ0700007_29
- Last Update 07/23/2025
- File Size 0.3MB
- # of Slides 2
- File Format PPTX
- Slide Ratio 16:9
- Color
Keywords
- #Content-Based Slides
- #Design-Based Slides
- #Business Management
- #Operational Plan
- #Diagram
- #Implementation Schedule
- #Project Implementation Schedule
- #Table
- #16:9
- #schedule table PowerPoint slide
- #timeline template
- #7-week operational plan slide
- #project timeline management PPT
- #horizontal schedule diagram
About the Product
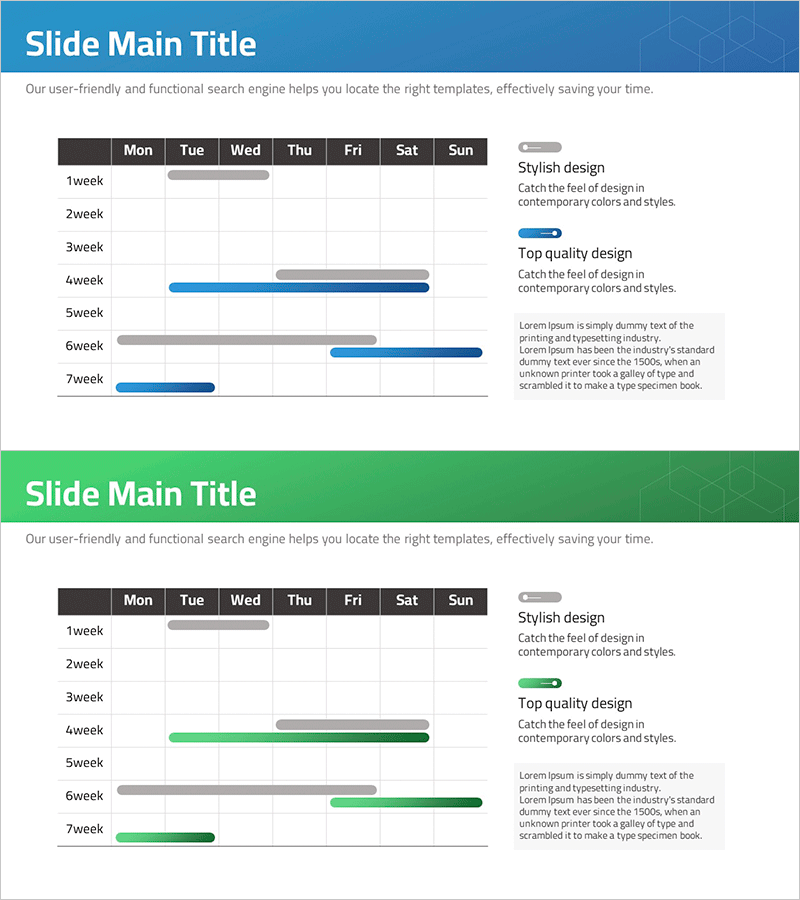
A timeline-based schedule table PowerPoint slide that displays a 7-week operational plan at a glance. The slide features a day-of-week grid (Monday through Sunday) with horizontal progress bars for each week, making it ideal for project timeline management and business progress tracking. The dual-tone blue and gray color scheme clearly distinguishes between completed and planned phases, while the right-side text area allows for detailed descriptions and key milestones at each stage. The 2-slide set provides multiple color combinations (blue and green) to maintain consistency across your presentation while enabling section differentiation. Delivered in fully editable PPTX format for immediate customization.
Usage Points
-
Main Usage
Manage and visualize mid-term project schedules (4–7 weeks) while supporting decision-making across teams. The day-of-week grid and horizontal progress bars clearly show the start, progress, and completion phases of each week, enabling the entire team to share and track timelines effectively.
-
How to Use
Insert this slide into the 'Implementation Timeline' or 'Execution Plan' section of business plans, operational plans, or project proposals. Adjust the length and color of each week's progress bar to match your project status, and fill in the right-side text area with key milestones, responsible parties, and expected outcomes. Presenting along the timeline enhances audience comprehension.
-
Recommended For
Ideal for project managers, operations teams, and business development teams managing mid-term schedules and reporting progress. Applicable to new business initiatives, product development roadmaps, marketing campaign timelines, organizational restructuring plans, and any presentation requiring a structured 4–7 week schedule.
-
Slide Structure
The slide comprises a title area at the top, a central day-of-week grid (Mon–Sun) with weekly progress bars (Week 1–7), and a right-side text description area. Progress bars use two colors (blue and gray) to represent different phases, allowing quick visual comparison of planned versus actual progress or scheduled versus current status.
Related Products
-

Modern Wide PowerPoint Schedule – Visualization of Business Plans
#Business Management #Operational Plan #Diagram
-

Origami Presentation Template Section Schedule – Business Progress Management
#Business Management #Operational Plan #Diagram
-

Overseas Travel Business Promotion Schedule Plan – Effective Preparation Strategies
#Business Management #Operational Plan #Diagram
-

Geometry PPT Template Wide Schedule – Essential for Project Management
#Business Management #Operational Plan #Diagram
