Virus Analysis Broken Line Graph – Market and Competitor Analysis
RJ0700007_10
- Last Update 07/23/2025
- File Size 1MB
- # of Slides 2
- File Format PPTX
- Slide Ratio 16:9
- Color
Keywords
- #Content-Based Slides
- #Design-Based Slides
- #Market and Competitor Analysis
- #Graph
- #Competitor Analysis
- #Market Analysis
- #Line
- #Line Chart
- #16:9
- #line chart PowerPoint
- #market analysis slide
- #competitor analysis presentation
- #trend visualization
- #dual-series line graph
- #PowerPoint chart template
- #how to create line chart in PowerPoint
About the Product
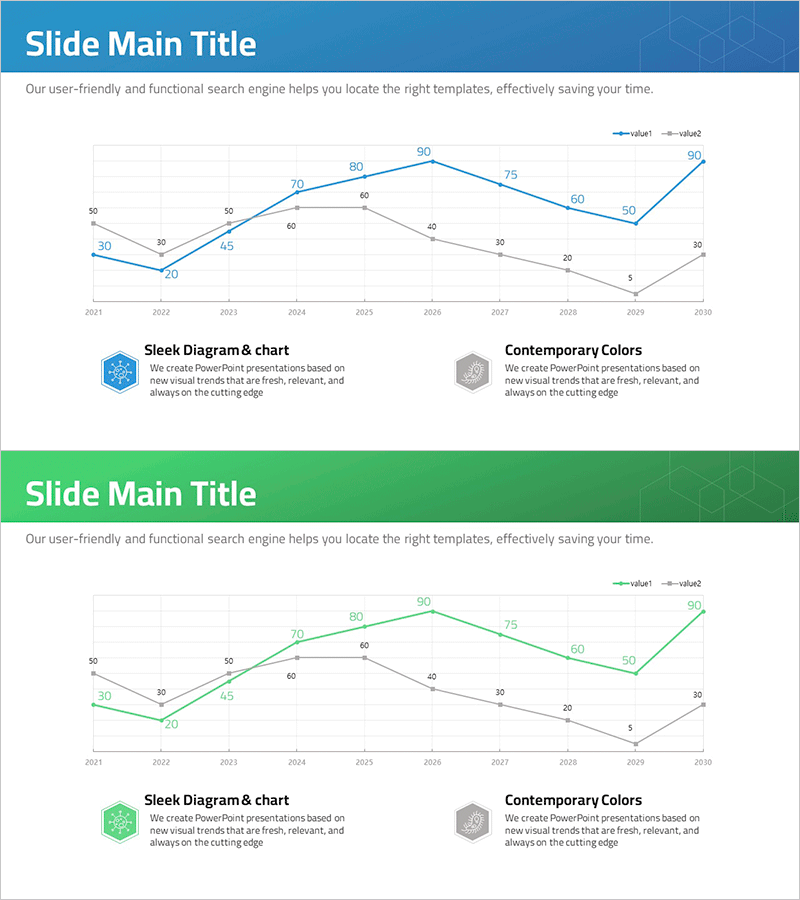
A dual-series line chart PowerPoint slide optimized for market and competitor analysis presentations. This template visualizes two data streams from 2021 to 2030 using distinct blue and gray lines, enabling clear comparative analysis across a 10-year period. Each slide features a title section, descriptive text area, and a comprehensive chart zone with icon-based legend and labeled data points. The 16:9 widescreen format includes 2 ready-to-use slides that effectively communicate numerical trends and performance trajectories for business reporting and strategic presentations.
Usage Points
-
Main Usage
Displays time-series data for market size evolution, competitive performance comparison, sales volume trends, and customer satisfaction metrics across two parallel indicators. The contrasting blue ascending and gray descending lines immediately communicate relative performance differences, while labeled data points ensure precise numerical communication and analytical clarity.
-
How to Use
Deploy in business reports, investor presentations, strategy meetings, and quarterly reviews to contextualize market conditions and competitive positioning. Slide 1 serves as trend overview; Slide 2 accommodates detailed analysis or alternative scenario modeling. Customize title and descriptive text fields to adapt the template for specific analytical narratives and organizational contexts.
-
Recommended For
Executives, marketing strategists, business planners, financial analysts, and management consultants preparing data-driven decision materials. Essential for quarterly and annual performance reporting, market share analysis, competitive strategy development, and stakeholder communication requiring quantitative evidence.
-
Slide Structure
Each slide employs a three-zone layout: top title area (blue header bar), central chart zone (dual-series line graph with gridlines and axis labels spanning 2021–2030, Y-axis 0–90 scale), and bottom legend with icon-based series identification. The chart includes two distinct line series, individual data point markers, gridline reference system, and customizable annotation areas.
Related Products
-

Competitor Analysis PC Mockup Graph – Market Trends and Insights
#Market and Competitor Analysis #Graph #Other
-

Competitor Analysis Broken Line Graph – Market Insights Provided
#Market and Competitor Analysis #Graph #Competitor Analysis
-

Market Analysis Graph & Notebook Mockup – Understanding the Market through Data Visualization
#Market and Competitor Analysis #Graph #Other
-

Year-by-year Growth Trend Graph – Market and Competitor Analysis
#Market and Competitor Analysis #Graph #Competitor Analysis
