European Target Market Status Graph – Market Share Insights
RJ0700007_18
- Last Update 07/23/2025
- File Size 0.8MB
- # of Slides 2
- File Format PPTX
- Slide Ratio 16:9
- Color
Keywords
About the Product
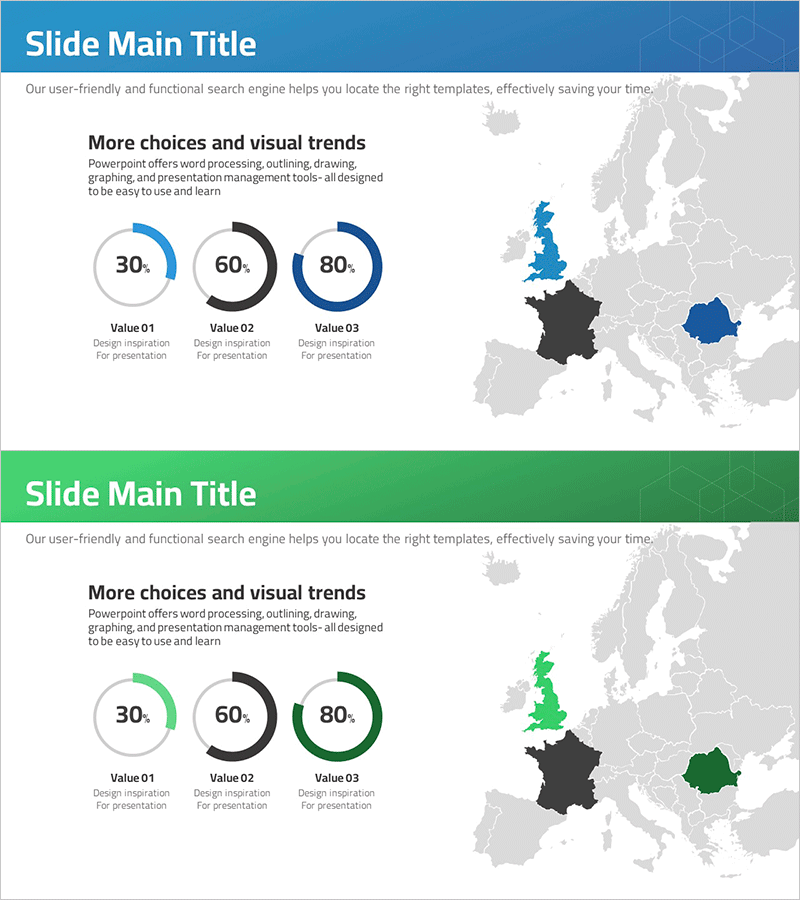
A donut chart PowerPoint slide designed to visualize European market status and regional market share distribution. This slide features three donut charts displaying 30%, 60%, and 80% proportions, paired with a European map background to emphasize geographic market scope. The blue, green, and black color scheme clearly distinguishes each data series, making it ideal for business strategy presentations, market research reports, and investor pitch decks. The 16:9 widescreen format includes two slide variations, ready for immediate editing and deployment in professional presentations.
Usage Points
-
Main Usage
Clearly visualizes market share, regional proportions, and data distribution using donut chart format. The integrated European map provides geographic context, enabling effective communication of market insights to investors and stakeholders in business presentations.
-
How to Use
Slide 1 contains three donut charts with European map background and header section. Slide 2 offers color variation in green and blue tones. Replace chart values and labels with your own data, and customize map highlighting to reflect your target markets and regional focus areas.
-
Recommended For
Marketing professionals, business development teams, and executives presenting market analysis findings. Ideal for business plans, investor pitch decks, market research reports, and strategic planning presentations where regional performance, customer distribution, or revenue composition needs to be communicated.
-
Slide Structure
Slide 1: Header area + title section + three donut charts (30%, 60%, 80% ratios) + value labels + background European map. Slide 2: Identical layout with green and blue color variations. Each donut chart is independently editable, and the map background uses transparent layering for easy customization.
Related Products
-

Donut Chart in Overseas Markets – Market Share Analysis
#Market and Competitor Analysis #Graph #Other
-

Target Market Share Analysis - Data Visualization with Graphs
#Market and Competitor Analysis #Graph #Other
-

Lighting Graph – Market Share and Target Analysis
#Market and Competitor Analysis #Graph #Other
-

Analysis of Target Market Construction Status – Data Visualization Tool
#Market and Competitor Analysis #Graph #Other
