Type-specific Analysis Radial Graph – Business Status Visualization
RJ0700007_27
- Last Update 07/23/2025
- File Size 1MB
- # of Slides 2
- File Format PPTX
- Slide Ratio 16:9
- Color
Keywords
- #Content-Based Slides
- #Design-Based Slides
- #Business Introduction
- #Graph
- #Technological Status
- #Other
- #Radar Chart Spider Chart
- #16:9
- #radial graph PowerPoint
- #radial chart template
- #7-axis data visualization
- #business performance analysis slide
- #multi-item comparison chart
- #radial diagram PowerPoint slide
About the Product
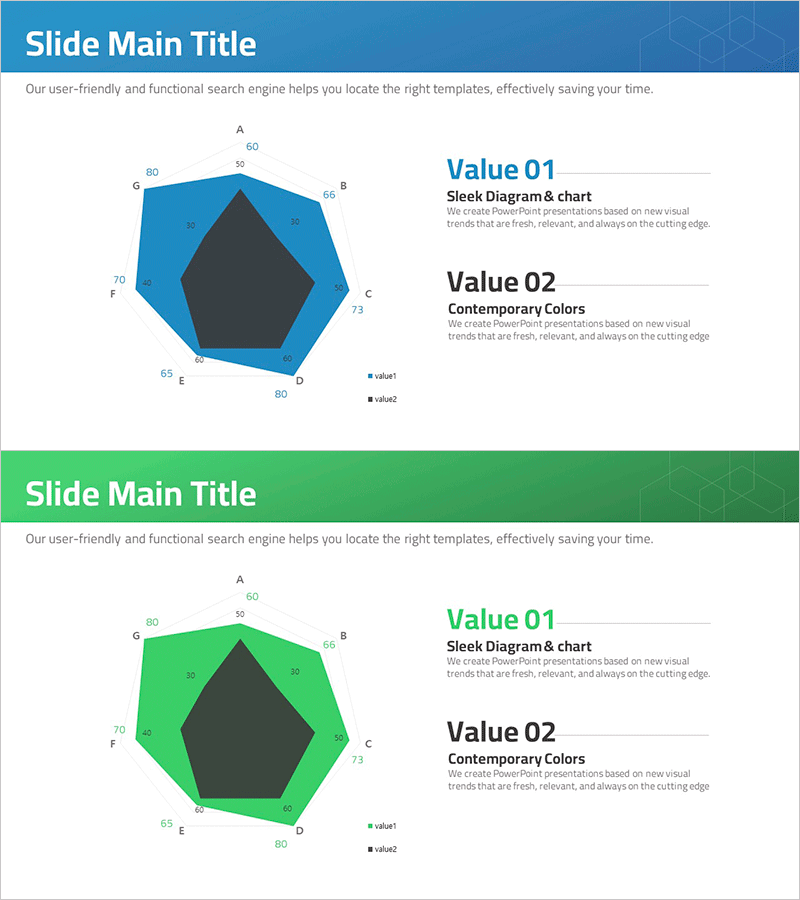
A 7-axis radial graph PowerPoint slide designed to analyze business performance and organizational capabilities from multiple perspectives. Centered on a dark pentagon, this slide displays seven data points (A through G) radiating outward, enabling simultaneous comparison of two data series in blue and green color schemes. Optimized for 16:9 widescreen format with 2-slide composition, it is ready to use for technology assessment, competency analysis, performance benchmarking, and comparative evaluation presentations. All axis values (50–80) are fully editable to reflect actual data, and the right-side Value 01 and Value 02 text areas allow you to add contextual insights and highlight key findings.
Usage Points
-
Main Usage
Visualize organizational competency assessment, departmental performance comparison, technology status evaluation, and competitive benchmarking by displaying multiple indicators simultaneously. The 7-axis structure enables comprehensive evaluation results to be communicated effectively in a single visual.
-
How to Use
Replace the axis values (50–80) with your actual data and populate the Value 01 and Value 02 sections with analysis insights. Customize the blue or green color scheme to align with your corporate branding. The 2-slide format allows sequential presentation of comparative analysis results.
-
Recommended For
Executive reports, business planning presentations, organizational capability assessments, technology status briefings, performance analysis meetings, and investment pitch decks. Ideal for executives, strategists, business analysts, and consultants who need data-driven decision-making visuals.
-
Slide Structure
2-slide composition. Each slide features a central dark pentagon with 7 axes (A–G) radiating outward. Blue or green polygons represent data values along each axis, with Value 01 and Value 02 text boxes and description areas positioned on the right. A legend (value1, value2) distinguishes the two data series.
Related Products
-

Online Shopping Mall System Radial Graph – Dynamic Data Visualization
#Business Introduction #Market and Competitor Analysis #Graph
-

Big Data Development Status Radial Graph – Captivating Visual Appeal
#Product/Service Introduction #Business Introduction #Diagram
-

Goal Setting & Radial Graph – Intuitive Data Visualization
#Business Introduction #Market and Competitor Analysis #Diagram
-

More Choices in Visual Trends for Effective Presentation Design
#Product/Service Introduction #Business Introduction #Graph
