Blue Green Donut Circle Graph for Market Share Visualization - Market Analysis and Strategy
RJ0700007_5
- Last Update 07/23/2025
- File Size 0.3MB
- # of Slides 2
- File Format PPTX
- Slide Ratio 16:9
- Color
Keywords
- #Content-Based Slides
- #Design-Based Slides
- #Product/Service Introduction
- #Market and Competitor Analysis
- #Graph
- #Development Status
- #Market Share
- #Circles
- #Doughnut Chart
- #16:9
- #donut chart PowerPoint
- #pie chart slide template
- #market share visualization
- #circular graph presentation
- #donut graph slide design
About the Product
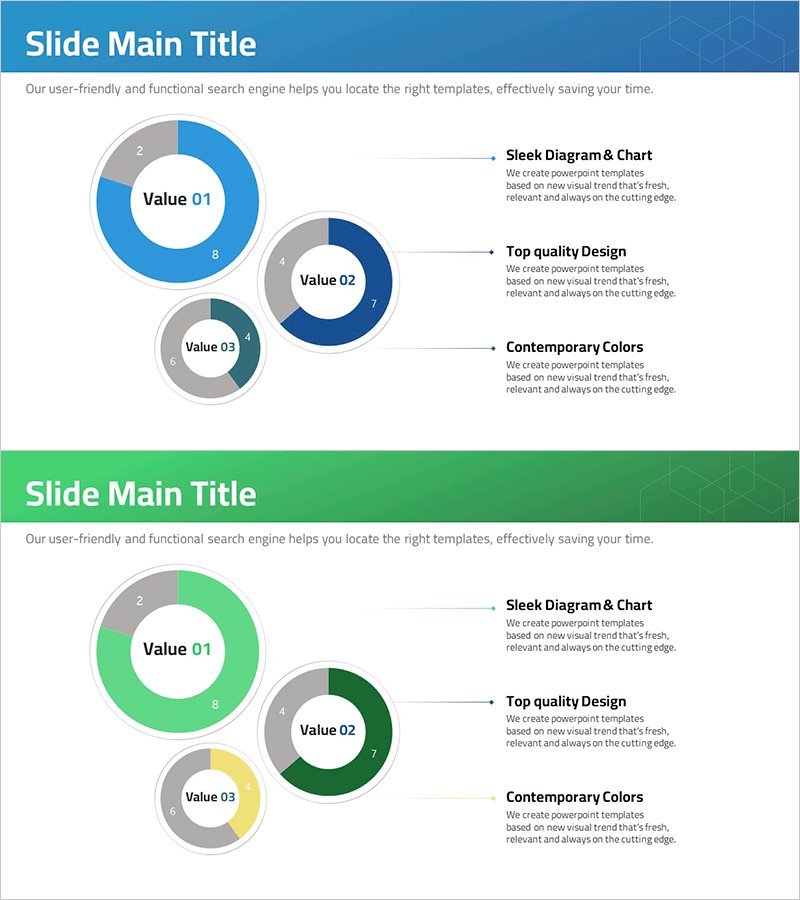
A donut chart PowerPoint slide optimized for market analysis and competitive strategy presentations. The 3-segment structure in blue and green tones effectively visualizes market share, customer composition, sales ratios, and budget allocation. The 2-slide set accommodates various data scenarios with 16:9 widescreen formatting. Each segment includes numeric labels and descriptive text positioned for audience clarity. Ready-to-use for business presentations, quarterly reports, marketing plans, and investor pitches.
Usage Points
-
Main Usage
Clearly visualizes proportional relationships such as market share, customer segments, sales distribution, and budget allocation. The hollow center of the donut design emphasizes key metrics or titles, effectively directing audience attention to critical data points.
-
How to Use
Edit segment values and labels with your own data. The blue and green color scheme conveys both reliability and growth, making it ideal for finance, technology, and marketing presentations. Stack the 2 slides sequentially to show trends and changes over time periods.
-
Recommended For
Marketing managers, sales directors, executives, consultants, and analysts presenting market conditions, competitive analysis, and business performance. Suitable for business plans, quarterly reports, investor presentations, and client proposals requiring data-driven decision-making.
-
Slide Structure
2-slide set with each slide featuring a 3-segment donut chart as the focal point. Segments arranged as Value 01 (blue), Value 02 (dark blue), and Value 03 (green-gray tones) from upper left. Right side displays descriptive text and labels connected by arrows. Optimized for 16:9 widescreen format.
Related Products
-

Website Technology Development Status Graph – Market Share and Trends
#Product/Service Introduction #Market and Competitor Analysis #Graph
-

Development Status Analysis Donut Chart – Market Share Visualization
#Product/Service Introduction #Market and Competitor Analysis #Graph
-

Analysis of Transportation Usage Status – Pie Chart
#Product/Service Introduction #Market and Competitor Analysis #Graph
-

Business Idea Development Status Graph – Ideas and Growth
#Product/Service Introduction #Market and Competitor Analysis #Graph
