Hexagon Diagram & Horizontal Bar Graph – Elevating Visual Appeal
RJ0700007_20
- Last Update 07/23/2025
- File Size 0.3MB
- # of Slides 2
- File Format PPTX
- Slide Ratio 16:9
- Color
Keywords
- #Content-Based Slides
- #Design-Based Slides
- #Product/Service Introduction
- #Market and Competitor Analysis
- #Graph
- #Development Status
- #Market Analysis
- #Horizontal Bar
- #Segmented Horizontal Bar
- #16:9
- #hexagon diagram PowerPoint
- #horizontal bar chart slide
- #data visualization template
- #market analysis presentation
- #product introduction slide deck
About the Product
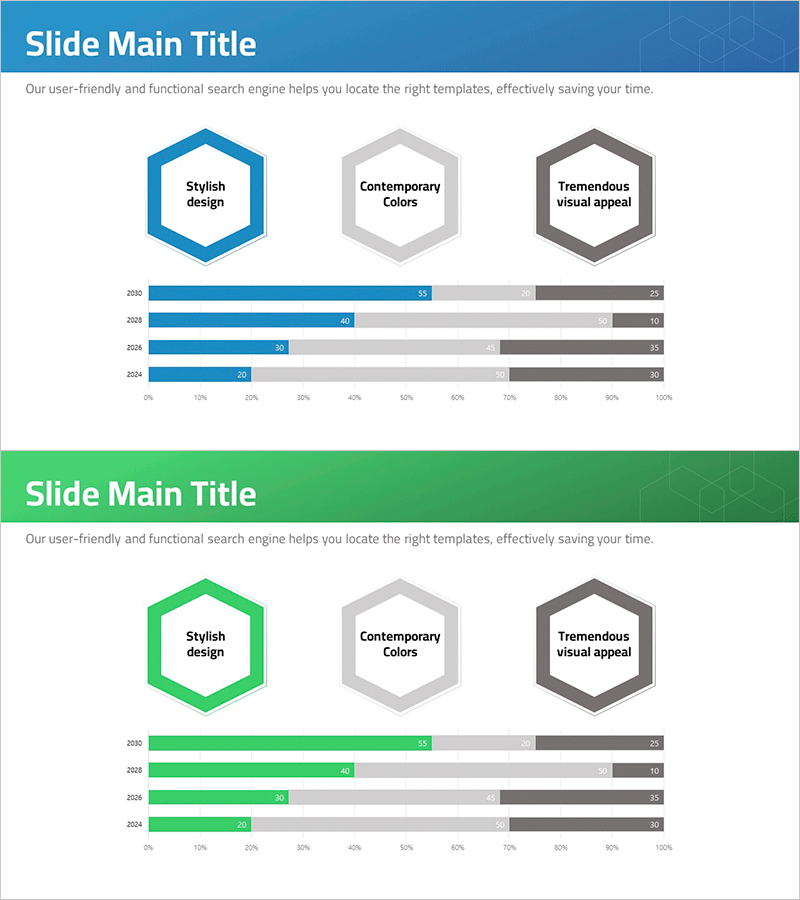
A 2-slide PowerPoint presentation combining hexagon diagrams with horizontal bar charts for data visualization. Designed in blue, gray, and black color scheme, this slide deck is optimized for market analysis, product introduction, and performance comparison presentations. Each slide features a 16:9 widescreen format with three hexagon elements and four-series year-over-year horizontal bars for systematic information display. Use these slides to emphasize key metrics and enhance audience comprehension during business presentations.
Usage Points
-
Main Usage
Emphasize key metrics and enhance audience understanding in market analysis, product introduction, and performance comparison presentations. Hexagon elements define core characteristics while horizontal bar graphs clearly communicate year-over-year and item-by-item numerical comparisons.
-
How to Use
Slide 1 uses three hexagon diagrams to define core concepts (stylish design, contemporary colors, visual appeal), while Slide 2 displays four-year horizontal bar graphs (2021–2024) showing trends. Directly edit text and values to customize the slides for your specific presentation content.
-
Recommended For
Recommended for marketing, sales, and planning professionals presenting market analysis; product development teams introducing new products; executive reports comparing performance metrics; and consulting proposals requiring data-driven analysis. Suitable for any business presentation requiring quantitative evidence.
-
Slide Structure
Slide 1: Three hexagon diagrams in blue, gray, and black with text labels / Slide 2: Four-year horizontal bar graph (2021–2024) with three-color series, percentage indicators, and legend. 16:9 widescreen PPTX format with fully editable elements.
Related Products
-

Bar Graph Visualization of Workplace Preferences
#Product/Service Introduction #Market and Competitor Analysis #Graph
-

Camera Shooting App Analysis Graph – Visualization and Insights
#Product/Service Introduction #Market and Competitor Analysis #Graph
-

Development Analysis Donut Graph – Visual Data Presentation
#Product/Service Introduction #Market and Competitor Analysis #Graph
-

Manufacturing Analysis Graph – Market and Competitive Analysis
#Product/Service Introduction #Market and Competitor Analysis #Graph
