Cylinder Shape Graph & Table Slide – Visualizing R&D Data
RJ0700007_24
- Last Update 07/23/2025
- File Size 0.3MB
- # of Slides 2
- File Format PPTX
- Slide Ratio 16:9
- Color
Keywords
About the Product
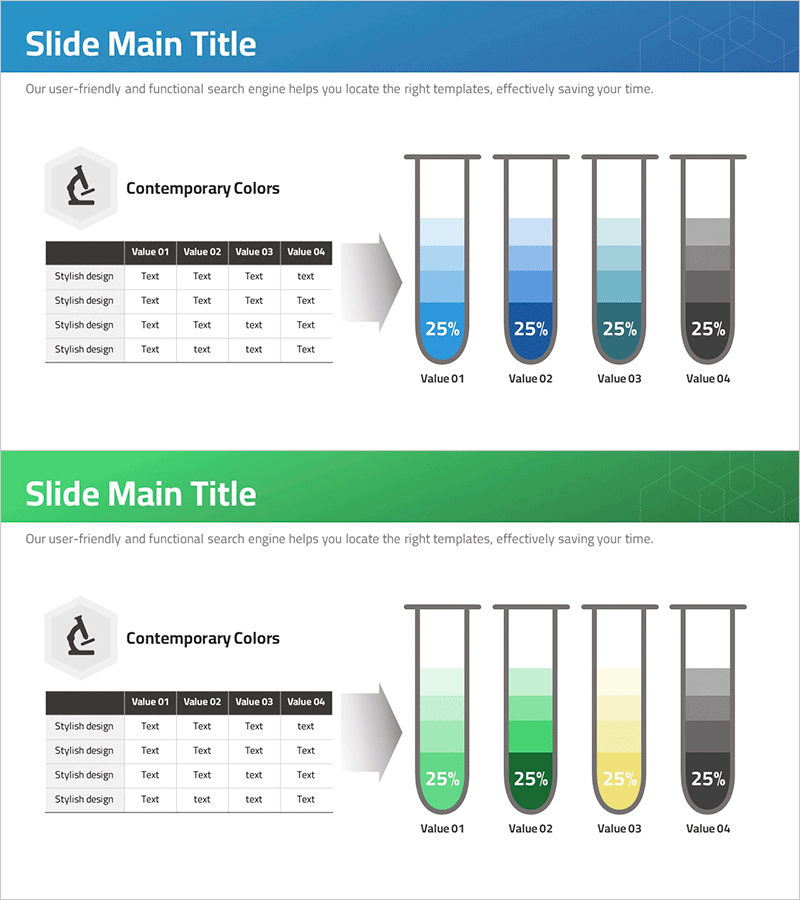
A PowerPoint slide combining cylinder-shaped graphs with data tables to visualize research and development metrics. The left table accommodates four data values that automatically populate the right cylinder graph visualization. The design features blue gradient cylinders against a neutral gray background, emphasizing data credibility and analytical rigor. Formatted in 16:9 widescreen ratio across 2 slides, this template is ready for immediate use in technical presentations, financial reports, market analysis briefings, and any data-driven business communication.
Usage Points
-
Main Usage
Transforms quantitative data into a clear 4-value comparison structure, enabling stakeholders to grasp relative magnitudes at a glance. The cylinder heights visually represent numerical differences while the accompanying table provides precise figures, balancing intuitive design with analytical accuracy.
-
How to Use
Input actual values into the left table's Value 01–04 columns; the right cylinder graph updates automatically. Cylinder heights and color gradients represent data hierarchy, with 25% labels indicating proportional relationships. Customize colors and text to match your presentation theme.
-
Recommended For
R&D teams presenting development milestones, finance departments reporting quarterly performance, marketing teams analyzing market share, executive leadership reviewing KPIs, and investor relations teams explaining growth metrics. Ideal for technical, financial, and strategic business presentations.
-
Slide Structure
Each slide contains three functional zones: header area (title and descriptive text), left data table (4 rows × 4 columns for input), and right cylinder visualization (4-item comparison). Two slide variants in blue and green gradients allow flexible color matching to document branding.
Related Products
-

Idea Development Analysis Chart – Data-Driven Innovation
#Product/Service Introduction #Business Introduction #Diagram
-

Strategic Positioning Map – Market Analysis and Marketing Strategy
#Market and Competitor Analysis #Marketing Plan and Strategy #Diagram
-

Business Area Analysis Graph & PC Mockup
#Technical Approach #Market and Competitor Analysis #Graph
-

Artificial Intelligence Development Market Positioning Map – Effective Visual Data Comparison
#Market and Competitor Analysis #Marketing Plan and Strategy #Diagram
