Yearly Global Map Slide for Visualizing Global Network
RJ0700007_9
- Last Update 08/29/2025
- File Size 0.7MB
- # of Slides 2
- File Format PPTX
- Slide Ratio 16:9
- Color
Keywords
About the Product
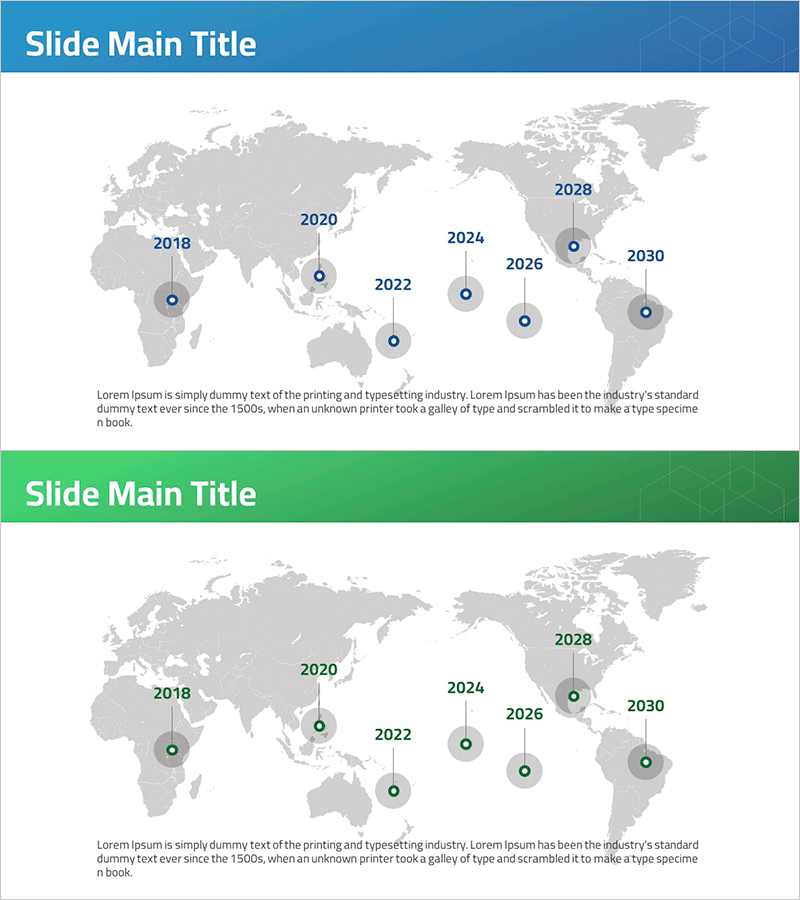
A 2-slide PowerPoint presentation featuring a world map with timeline markers for global business expansion and international network visualization. The design displays eight key years from 2018 to 2030 as circular markers positioned on a grayscale world map, each labeled with the corresponding year. Two color variations are included: a blue header version and a green header version, allowing you to match your presentation's visual identity. Vertical connector lines link each milestone to create a clear chronological flow. Ideal for showcasing company expansion timelines, overseas office openings, international partnership growth, and global market penetration strategies in investor pitches, company overviews, and strategic presentations.
Usage Points
-
Main Usage
Communicate your company's international expansion milestones, overseas office establishment dates, and global partnership growth through a geographic timeline. Helps investors, partners, and stakeholders quickly grasp the scale and trajectory of your global network.
-
How to Use
Replace the year labels and map markers with your company's actual expansion dates and locations. Add specific details such as office names, business focus, revenue figures, or partnership information in the text area below each marker. Select either the blue or green header version to align with your corporate brand colors.
-
Recommended For
Best suited for company overview presentations, investor pitch decks, business plans, annual reports, and strategic expansion briefings. Recommended for international business teams, C-suite executives, and investor relations professionals.
-
Slide Structure
Two slides, each featuring a grayscale world map background, a colored header bar (blue or green) with title space, eight circular milestone markers with year labels positioned across continents, vertical timeline connectors, and a descriptive text area at the bottom for additional context.
Related Products
-

Global Map and Learning Icons Slide – Effective Market Analysis
#Company Introduction #Market and Competitor Analysis #Other
-

Global Map and People Illustration – Understanding Global Networks
#Company Introduction #Other #Global Network
-

Highlighted Circular Global Map – Effective Market Analysis
#Company Introduction #Market and Competitor Analysis #Other
-

Global Network and Icon Sign – Connecting Customers and Partners
#Company Introduction #Other #Global Network
