Future Outlook Analysis Bar Graph – Essential for Market Analysis
RJ0700007_14
- Last Update 07/23/2025
- File Size 1MB
- # of Slides 2
- File Format PPTX
- Slide Ratio 16:9
- Color
Keywords
About the Product
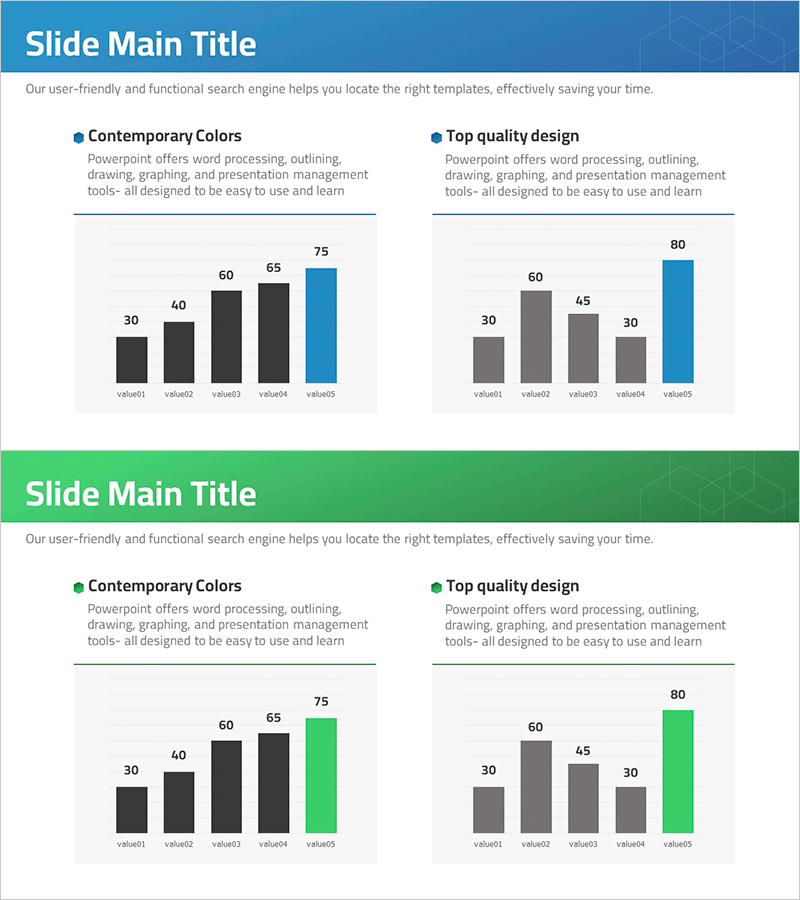
A horizontal bar chart PowerPoint slide designed for visualizing market analysis and future outlook data. This presentation template features five comparable data points displayed side-by-side, allowing you to input and edit values directly in PowerPoint. The design uses blue accent bars and gray reference bars to create strong visual contrast, with integrated title, description, and legend sections ready for immediate use. Perfect for business reports, marketing plans, investment pitches, and strategic presentations requiring clear data comparison.
Usage Points
-
Main Usage
Displays numerical data for market analysis, competitive benchmarking, and performance comparison using horizontal bar layout for intuitive item-to-item size comparison. The dual-bar structure—blue accent bar highlighting key metrics and gray reference bar providing context—enables viewers to quickly grasp relative values and trends.
-
How to Use
Double-click each bar value and item label in PowerPoint to input your data. Modify the legend and title text freely, and adjust bar colors through shape formatting options if needed. Apply this slide to market analysis sections in business reports, competitive analysis in marketing plans, performance comparisons in investor decks, and strategic planning presentations.
-
Recommended For
Business analysts, marketing managers, financial planners, and executives presenting market trends, sales performance, customer satisfaction metrics, and competitive indicators. Particularly effective when comparing five or fewer data points where readability is critical.
-
Slide Structure
Two-slide set, each featuring a blue header title area and two independent horizontal bar chart sections. Each chart displays five data points (value01–value05) with one blue accent bar and one gray reference bar per item. Optimized for 16:9 widescreen format with professional spacing and alignment.
Related Products
-

Comparison Graph of Future Outlook - Essential Tool for Market Analysis
#Market and Competitor Analysis #Graph #Future Outlook
-

Blue Red Analysis Chart – New Insights into Market Analysis
#Market and Competitor Analysis #Diagram #Graph
-

Idea Development Future Outlook Graph – Essential Template for Market Analysis
#Market and Competitor Analysis #Graph #Future Outlook
-

A Bar Graph Showing Future Prospects
#Market and Competitor Analysis #Graph #Future Outlook
