US Target Market Analysis Graph – Understanding Market Segmentation
RJ0700007_25
- Last Update 07/23/2025
- File Size 1.1MB
- # of Slides 2
- File Format PPTX
- Slide Ratio 16:9
- Color
Keywords
- #Content-Based Slides
- #Design-Based Slides
- #Market and Competitor Analysis
- #Marketing Plan and Strategy
- #Graph
- #Other
- #Target Market
- #Target Market Strategy
- #Horizontal Bar
- #Segmented Horizontal Bar
- #Map
- #16:9
- #US map PowerPoint slide
- #market analysis presentation
- #regional market segmentation
- #target market analysis chart
- #marketing strategy map
About the Product
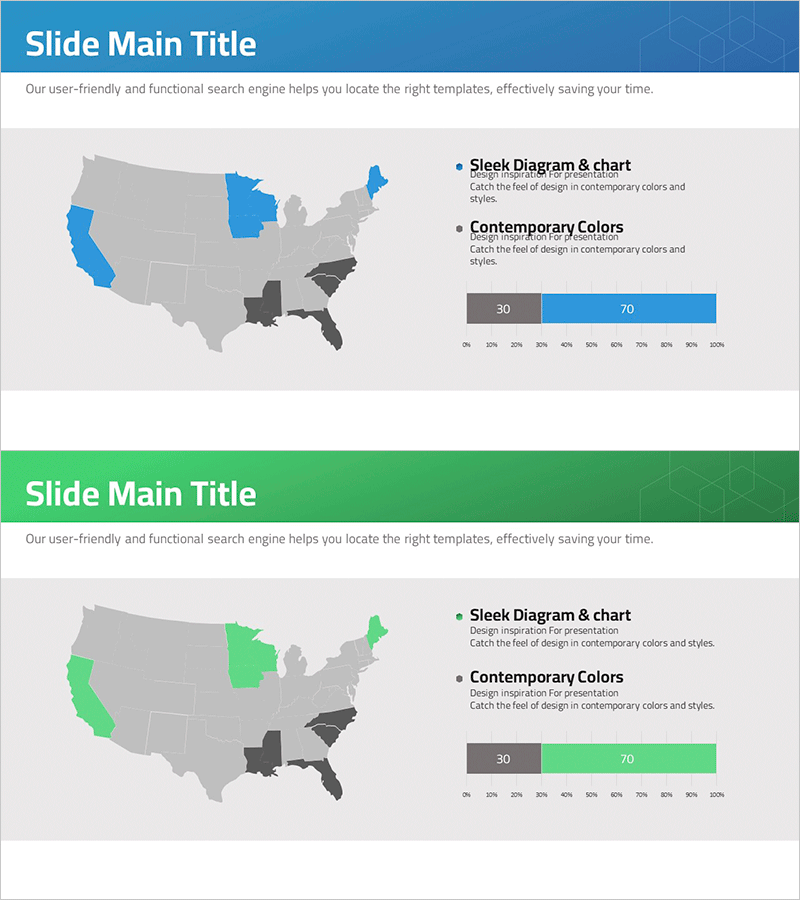
A geographic PowerPoint slide designed for US target market analysis and regional market segmentation strategy. The slide features a US map with five states highlighted in blue and dark gray against a neutral background, clearly visualizing regional market focus areas. Paired with a horizontal bar chart showing a 30:70 data ratio, this presentation slide effectively communicates market size and growth potential by region. The 2-slide set integrates seamlessly into business presentations and allows full customization of colors, data values, and text elements for tailored marketing strategy presentations.
Usage Points
-
Main Usage
Visualize US market analysis by region and communicate target market segmentation strategy in business presentations. The combination of geographic map highlighting and accompanying bar chart enables simultaneous display of regional market size and growth rates, making it an effective decision-support tool.
-
How to Use
Insert into marketing strategy presentations, business proposals, and investor pitch decks within the market analysis section. Customize map colors to match corporate branding and update bar chart data with actual market figures to create tailored presentation materials.
-
Recommended For
Marketing professionals, business strategy teams, sales planners, and investor relations specialists. Particularly effective for US market entry strategies, regional sales planning, and global business expansion presentations where geographic market analysis is critical.
-
Slide Structure
Slide 1: US map with five states highlighted in blue and dark gray, accompanied by 'Market Analysis' text on the right side. Slide 2: Same map configuration with a 30:70 horizontal bar chart positioned in the lower right. Both slides include title area at top and descriptive text space for customization.
Related Products
-

Target Market Analysis Bar Graph – Visualizing Market Strategies
#Market and Competitor Analysis #Marketing Plan and Strategy #Graph
-

Slide Template for European Target Market Goals
#Market and Competitor Analysis #Marketing Plan and Strategy #Other
-

Map of Major Target Areas in the United States – Market Analysis and Marketing Strategy
#Market and Competitor Analysis #Marketing Plan and Strategy #Other
-

Current Status of Fountain Pen Business by Country – Infographic Template for Market Analysis
#Market and Competitor Analysis #Marketing Plan and Strategy #Other
